Hello everyone,
I used Power BI to build an HR Dashboard that turns employee data into interactive insights.
This project gave me the opportunity to work with:
📌 Data cleaning and transformation
📌 Data modelling
📌 DAX measures
📌 Interactive visuals
📌 Slicers and filters
It's about understanding the data, asking the right questions, and presenting insights that can support better business decisions.
I'm grateful to my tutor and the LS Academy team for the practical learning environment and the opportunity to keep improving my skills.
📌 KPI reporting
📌 Dashboard design and data storytelling
One thing I'm learning is that building a dashboard isn't just about making visuals look good.
Another milestone in my learning journey at LS Academy! 📊
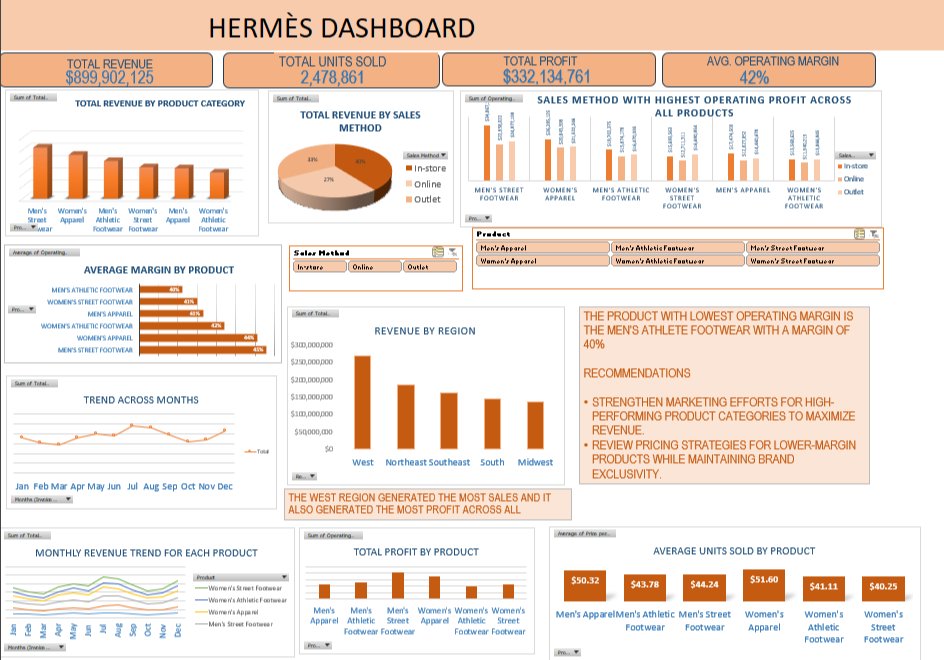
This time, I built an interactive dashboard in Microsoft Excel to analyze sales performance and present key business insights.
Disclaimer: This is an educational project created using dummy data for learning purposes. The company name, branding, products, and figures presented in the dashboard are fictional and do not represent the actual business, data, or performance of any real company.
Disclaimer: This dashboard was created for educational purposes using a dummy dataset. While the dashboard is branded as Hermès for presentation, it is not based on Hermès' actual business data or performance. @leinadstudios#LSacademy2026scholarship#ExcelDashboard#DataAnalysis