A billionaire trader has spent 40 years trying to delete a one-hour documentary. It shows him making $100 million in a single afternoon. He predicted the crash that made it possible three months in advance. He has never explained why he wants the film gone. His name is Paul Tudor Jones. The film is on YouTube.
The documentary is called "Trader." PBS filmed it in 1987, three months before Black Monday. Jones was 32 years old, working from a small New York office, wearing shorts and a t-shirt, yelling at his phones, throwing paper across the room, and sleeping under his desk. The film captures him and his research partner Peter Borish overlaying a chart of the 1929 market on 1987, month by month. The two charts tracked within one percent. Borish said this is exactly what happened in 1929. Jones said if the analog holds, October is when it breaks.
On October 19, 1987, the Dow fell 22.6 percent in a single day. It remains the largest one-day percentage loss in stock market history. That afternoon, Tudor Jones covered his shorts and made roughly $100 million. He was 33 years old. He was one of the very few traders on the street who came out ahead.
He tried to bury the tape because it made him look reckless in a professional world that punished swagger. Twenty years of legal effort did not delete it. Someone kept a copy. It is on YouTube. It has fewer views than most makeup tutorials.
The film is not really about a crash. It is about a specific philosophy of trading. Jones is shown building conviction slowly, sizing carefully, then striking hard when the setup arrives. He is never once shown making a random bet. He is shown doing the same thing five times a day, every day, for three months.
His signature line, repeated across a 45-year career:
"The most important rule of trading is to play great defense, not great offense."
He does not try to be right. He tries not to lose. He sets stops tight, cuts positions fast, and never averages down on a loser. Every trade in the film follows this template.
Tudor Investment Corp, the fund he founded in 1980, has compounded at roughly 19 percent a year for 45 years. He is 71 years old and still trading. His method has not changed since the film.
The lesson: greatness in markets is a refusal, not a talent. Refusal to be reckless. Refusal to be certain. Refusal to average down. Refusal to trust yourself in a drawdown. Tudor Jones has refused those refusals for 45 years.
The tape is free. The philosophy is repeated in every trade. Most traders will never watch it.
Anthropic just released a 4-hour course to getting a $500k AI engineering job:
00:15 - The right way to prompt Claude
33:21 - What makes Claude act dumber on your code
01:33:39 - How Anthropic use Claude every day
02:50:56 - The fix that makes Claude way smarter This
4-hour Anthropic free course replaces about 10 paid engineering courses.
Watch it today, then read the step-by-step guide on building loops below.
This is Pradeep Bonde.
For nearly 20 years he's quietly run one of the most respected trading blogs online, under the name Stockbee.
No tips. No hype. No tall claims.
More than one of today's most famous momentum traders traces their foundation back to him.
Here's his philosophy 🧵
High momentum names for the next day.
Feedback is positive from breakouts, participation from multiple groups/sectors, my HOD list has been expanding continuously.
Healthy environment for trading breakouts :)
Mark Minervini is overrated.
His strategies don't work anymore.
That's what his critics love to say.
But I spent a full year inside his Private Access program in 2024 and 25.
It quietly changed how I trade.
Here's the one pattern his whole method is built on 👇
HERE’S THE EXACT STRONG STOCKS SCAN
BUILT FROM SCRATCH TO CATCH WINNERS
Tool used: @tradingview (I run ALL my scans on TV)
Bookmark this post right nown.
I will drop the direct scan link for you to copy-paste in Comments.
Why India is sleeping on REITs.
India has 5 listed REITs. Most retail portfolios own zero of them.
Seven years after Embassy's IPO, the asset class is still treated like a footnote. Let me lay out why that's a mistake.
What a REIT actually is
A SEBI-regulated trust that owns income-producing commercial real estate — offices and malls. By law, it must distribute 90% of its rental income to unit-holders every quarter. You buy it on the NSE like any equity.
The five listed:
• Embassy (2019) — office
• Mindspace (2020) — office
• Brookfield (2021) — office
• Nexus Select Trust (2023) — retail malls
• Knowledge Realty Trust (2025) — office
That's the entire universe. ~₹2 lakh crore total market cap. Versus the US, where REITs are a $1.4 trillion asset class.
Equity in trading and taxation. Debt in payouts. Real estate underneath. One ticker, three asset characteristics.
Performance vs Nifty 500 TRI and 10y G-Sec — period-matched
Each REIT measured over its own listed window, against Nifty 500 TRI and the 10-year Gilt over the SAME window:
• Embassy (7.1y): Nifty 500 14.0% > Embassy 10.8% > 10y G-Sec 6.8%
• Mindspace (5.7y): Nifty 500 18.3% > Mindspace 13.8% > 10y G-Sec 5.1%
• Brookfield (5.2y): Nifty 500 13.1% > Brookfield 10.5% > 10y G-Sec 5.4%
• Nexus Select (3.0y): Nexus 21.3% > Nifty 500 15.3% > 10y G-Sec 6.1%
For context — buying a flat in India without a loan and renting it out has returned ~6.4% a year over the past 7 years (BIS Housing Price Index + ~2.5% gross rental yield, unlevered).
G-Secs are obviously the safest of the three — sovereign-guaranteed, near-zero credit risk. Lower returns are the price for that safety.
Three of four REITs trailed equity over their full windows. Only Nexus beat. All four comfortably beat fixed income; all five comfortably beat unlevered residential real estate.
Risk-adjusted returns (Sharpe) tell the same story — Nifty 500 edges out 3 of the 4 REITs with enough history.
The pitch isn't total return. It's everything below.
The cash yield is the silent hammer
Pre-tax yield comparison:
• REITs (TTM, 4 mature): ~6.7%
• Nifty 500 dividend yield: 1.13%
• 10-year G-Sec yield: ~6.5%
• Bank FD: ~7%
REITs yield roughly 5x what the Nifty 500 pays in dividends — and competitive with G-Sec / FD, but with equity-like upside on the underlying real estate.
The cash arrives quarterly. Predictable. Contracted at the lease level (most leases have 5-15% rent escalations every 3 years).
Diversification — REITs are a third asset
Average 3-year monthly correlations:
• REIT ↔ Nifty 500 TRI: 0.21
• REIT ↔ AAA bonds: 0.27
Anything below 0.4 is a weak relationship; above 0.7 means the assets move together.
For context: Nifty 50 ↔ Nifty 500 is 0.97. The 20-year correlation between Nifty 500 and 10y Gilt is 0.08 — but it's risen to 0.51 in the latest 5-year window because both got hit in the rate-hike cycle.
REITs at 0.21 with equity offer better diversification than bonds do in the current regime.
Access — REITs are the only door under ₹5 Cr
Commercial real estate yields meaningfully more than residential. But a single Grade-A office unit starts at ₹2-5 Cr.
If you have under ₹5 Cr to allocate to property, REITs are pretty much the only way to participate in commercial real estate. Diversified across 20-50+ buildings, multiple cities, dozens of MNC tenants. One click, ~₹400 per unit.
NAV — the part most people don't understand
Like an ETF, a REIT has two prices:
→ NAV — what an independent SEBI-registered valuer says the underlying real estate is actually worth. Formula: (Building values − Debt + Cash) ÷ Units outstanding. Refreshed only twice a year — every March 31 and September 30 (a SEBI mandate, not a company choice).
→ Market price — what buyers and sellers settle at on NSE, second by second.
For a normal ETF, arbitrage keeps the two glued together within paise. For a REIT, NAV updates twice a year, so market price drifts in between based on what investors think the next NAV will look like.
Right now, every mature REIT trades below its audited NAV:
• Embassy: -14.5% (₹491.62 NAV vs ₹420 traded)
• Mindspace: -10.7% (₹527 vs ₹470)
• Brookfield: -6.4% (₹349 vs ₹327)
• Nexus Select: -1.0% (₹159 vs ₹157)
Average: ~8% below independently audited fair value.
Why the persistent discount? Three forces:
(a) Investors demand higher cap rates than valuers. Embassy's March 2026 valuation used 7.5-8.25% cap rates. The market is pricing closer to 8.5-9% — wanting a bigger margin of safety given WFH risk and ~30% US tenant exposure.
(b) Big early backers are still selling. Blackstone exited Embassy through 2023-24. More supply than demand pushes prices down.
(c) REITs trade in equity portfolios. When broader markets fall, REITs get sold along with them — even when the buildings themselves are doing fine.
At today's prices, you're paying ~92 paise on the rupee for institutional-grade Grade-A real estate.
Tax math — better than equity on income, equal on capital gains
Capital gains taxation (post Budget 2024) — identical to listed equity
Where REITs win is on income. Distribution arrives in three components, taxed differently:
→ Interest (loan from REIT trust to SPVs, returning) — taxed at your slab rate
→ Dividend (from SPVs) — tax-free
→ Capital repayment (loan principal returning) — Why India is sleeping on REITs
India has 5 listed REITs. Most retail portfolios own zero of them.
Seven years after Embassy's IPO, the asset class is still treated like a footnote. Let me lay out why that's a mistake.
What a REIT actually is
A SEBI-regulated trust that owns income-producing commercial real estate — offices and malls. By law, it must distribute 90% of its rental income to unit-holders every quarter. You buy it on NSE like any equity.
The five listed:
• Embassy (2019) — office
• Mindspace (2020) — office
• Brookfield (2021) — office
• Nexus Select Trust (2023) — retail malls
• Knowledge Realty Trust (2025) — office
That's the entire universe. ~₹2 lakh crore total market cap. Versus the US, where REITs are a $1.4 trillion asset class.
Equity in trading and taxation. Debt in payouts. Real estate underneath. One ticker, three asset characteristics.
Performance vs Nifty 500 TRI and 10y G-Sec — period-matched
Each REIT measured over its own listed window, against Nifty 500 TRI and the 10-year Gilt over the SAME window:
• Embassy (7.1y): Nifty 500 14.0% > Embassy 10.8% > 10y G-Sec 6.8%
• Mindspace (5.7y): Nifty 500 18.3% > Mindspace 13.8% > 10y G-Sec 5.1%
• Brookfield (5.2y): Nifty 500 13.1% > Brookfield 10.5% > 10y G-Sec 5.4%
• Nexus Select (3.0y): Nexus 21.3% > Nifty 500 15.3% > 10y G-Sec 6.1%
For context — buying a flat in India without a loan and renting it out has returned ~6.4% a year over the past 7 years (BIS Housing Price Index + ~2.5% gross rental yield, unlevered).
G-Secs are obviously the safest of the three — sovereign-guaranteed, near-zero credit risk. Lower returns are the price for that safety.
Three of four REITs trailed equity over their full windows. Only Nexus beat. All four comfortably beat fixed income; all five comfortably beat unlevered residential real estate.
Risk-adjusted returns (Sharpe) tell the same story — Nifty 500 edges out 3 of the 4 REITs with enough history.
The pitch isn't total return. It's everything below.
The cash yield is the silent hammer
Pre-tax yield comparison:
• REITs (TTM, 4 mature): ~6.7%
• Nifty 500 dividend yield: 1.13%
• 10-year G-Sec yield: ~6.5%
• Bank FD: ~7%
REITs yield roughly 5x what the Nifty 500 pays in dividends — and competitive with G-Sec / FD, but with equity-like upside on the underlying real estate.
The cash arrives quarterly. Predictable. Contracted at the lease level (most leases have 5-15% rent escalations every 3 years).
Diversification — REITs are a third asset
Average 3-year monthly correlations:
• REIT ↔ Nifty 500 TRI: 0.21
• REIT ↔ AAA bonds: 0.27
Anything below 0.4 is a weak relationship; above 0.7 means the assets move together.
For context: Nifty 50 ↔ Nifty 500 is 0.97. The 20-year correlation between Nifty 500 and 10y Gilt is 0.08 — but it's risen to 0.51 in the latest 5-year window because both got hit in the rate-hike cycle.
REITs at 0.21 with equity offer better diversification than bonds do in the current regime.
Access — REITs are the only door under ₹5 Cr
Commercial real estate yields meaningfully more than residential. But a single Grade-A office unit starts at ₹2-5 Cr.
If you have under ₹5 Cr to allocate to property, REITs are pretty much the only way to participate in commercial real estate. Diversified across 20-50+ buildings, multiple cities, dozens of MNC tenants. One click, ~₹400 per unit.
NAV — the part most people don't understand
Like an ETF, a REIT has two prices:
→ NAV — what an independent SEBI-registered valuer says the underlying real estate is actually worth. Formula: (Building values − Debt + Cash) ÷ Units outstanding. Refreshed only twice a year — every March 31 and September 30 (a SEBI mandate, not a company choice).
→ Market price — what buyers and sellers settle at on NSE, second by second.
For a normal ETF, arbitrage keeps the two glued together within paise. For a REIT, NAV updates twice a year, so market price drifts in between based on what investors think the next NAV will look like.
Right now, every mature REIT trades below its audited NAV:
• Embassy: -14.5% (₹491.62 NAV vs ₹420 traded)
• Mindspace: -10.7% (₹527 vs ₹470)
• Brookfield: -6.4% (₹349 vs ₹327)
• Nexus Select: -1.0% (₹159 vs ₹157)
Average: ~8% below independently audited fair value.
Why the persistent discount? Three forces:
(a) Investors demand higher cap rates than valuers. Embassy's March 2026 valuation used 7.5-8.25% cap rates. The market is pricing closer to 8.5-9% — wanting a bigger margin of safety given WFH risk and ~30% US tenant exposure.
(b) Big early backers are still selling. Blackstone exited Embassy through 2023-24. More supply than demand pushes prices down.
(c) REITs trade in equity portfolios. When broader markets fall, REITs get sold along with them — even when the buildings themselves are doing fine.
At today's prices, you're paying ~92 paise on the rupee for institutional-grade Grade-A real estate.
Tax math — Identical to listed equity.
→ Interest (loan from REIT trust to SPVs, returning) — taxed at your slab rate
→ Dividend (from SPVs) — tax-free
→ Capital repayment (loan principal returning) — not taxed today. You pay capital gains tax (at the lower LTCG rate) whenever you eventually sell.
Net post-tax yield for a 30%-slab investor: roughly 5.5% on a 6.7% pre-tax distribution yield. An FD at 7% yields 4.9% post-tax. The math isn't close.
The inflation question
30 years of US data, average calendar-year return when CPI > 3%:
• Gold: +9.5%
• REITs: +9.0%
• Bonds: +6.3%
• S&P 500: +1.7%
REITs come in a close second to gold as an inflation hedge — and both decisively beat equity and bonds. The "real assets" thesis (rents escalate with CPI, replacement cost rises) plays out in the data.
If India drifts into a higher-CPI decade — likely as shelter inflation sticks — REITs are one of the few assets that handles it without bleeding.
The case against is real
→ Young — only 5 listed, oldest just 7 years of history
→ 4 of 5 are office-heavy (no warehousing, storage, or residential exposure) and ~30% of office REIT rent comes from US firms — GCC slowdown or de-globalisation policy is a tail risk
→ Bangalore-concentrated portfolios (60-75% of Embassy's GAV is in BLR alone)
→ Rate-hike sensitive — US REITs fell 26% in 2022's aggressive hiking cycle
→ Low trading liquidity (<₹40 Cr daily value for most; only Embassy is genuinely liquid)
→ No DRIP (dividend reinvestment plan) — distributions arrive as cash, manual reinvestment costs ~1-1.5pp/year of compounded TR
Bottom line
REITs trail equity in most windows. They beat fixed income comfortably. They beat unlevered residential real estate decisively. They're genuinely uncorrelated to both equity and bonds. They yield 5x the dividend cash of Nifty 500. They trade at ~8% discount to audited value. Capital gains taxed identically to equity. Distribution income mostly tax-efficient. They're a competitive inflation hedge — second only to gold.
The case to ignore them entirely is harder than the case to own them. Even at a modest 5-10% portfolio sleeve.
Net post-tax yield for a 30%-slab investor: roughly 5.5% on a 6.7% pre-tax distribution yield. An FD at 7% yields 4.9% post-tax. The math isn't close.
The inflation question
30 years of US data, average calendar-year return when CPI > 3%:
• Gold: +9.5%
• REITs: +9.0%
• Bonds: +6.3%
• S&P 500: +1.7%
REITs come in a close second to gold as an inflation hedge — and both decisively beat equity and bonds. The "real assets" thesis (rents escalate with CPI, replacement cost rises) plays out in the data.
If India drifts into a higher-CPI decade — likely as shelter inflation sticks — REITs are one of the few assets that handles it without bleeding.
The case against is real
→ Young — only 5 listed, oldest just 7 years of history
→ 4 of 5 are office-heavy (no warehousing, storage, or residential exposure) and ~30% of office REIT rent comes from US firms — GCC slowdown or de-globalisation policy is a tail risk
→ Bangalore-concentrated portfolios (60-75% of Embassy's GAV is in BLR alone)
→ Rate-hike sensitive — US REITs fell 26% in 2022's aggressive hiking cycle
→ Low trading liquidity (<₹40 Cr daily value for most; only Embassy is genuinely liquid)
→ No DRIP (dividend reinvestment plan) — distributions arrive as cash, manual reinvestment costs ~1-1.5pp/year of compounded TR
Bottom line
REITs trail equity in most windows. They beat fixed income comfortably. They beat unlevered residential real estate decisively. They're genuinely uncorrelated to both equity and bonds. They yield 5x the dividend cash of Nifty 500. They trade at ~8% discount to audited value. Capital gains taxed identically to equity. Distribution income mostly tax-efficient. They're a competitive inflation hedge — second only to gold.
The case to ignore them entirely is harder than the case to own them. Even at a modest 5-10% portfolio sleeve.
Came across this document of Qullamagi’s 2020–2021 trade positions.
If you go through these trades, one of the best things you’ll notice is the risk–reward. There a lot of losing trades. But the losses are not big, mostly around one or two X.
On the other hand, the winning trades are much bigger.
If you go through the stock names, try to understand the thought process behind each trade.
Yes, this is from 2021, but a lot of things can still be understood today if you go through these trades.
Go through it. Try to understand it. Good luck.
Link - https://t.co/7Yl0qzb1AW
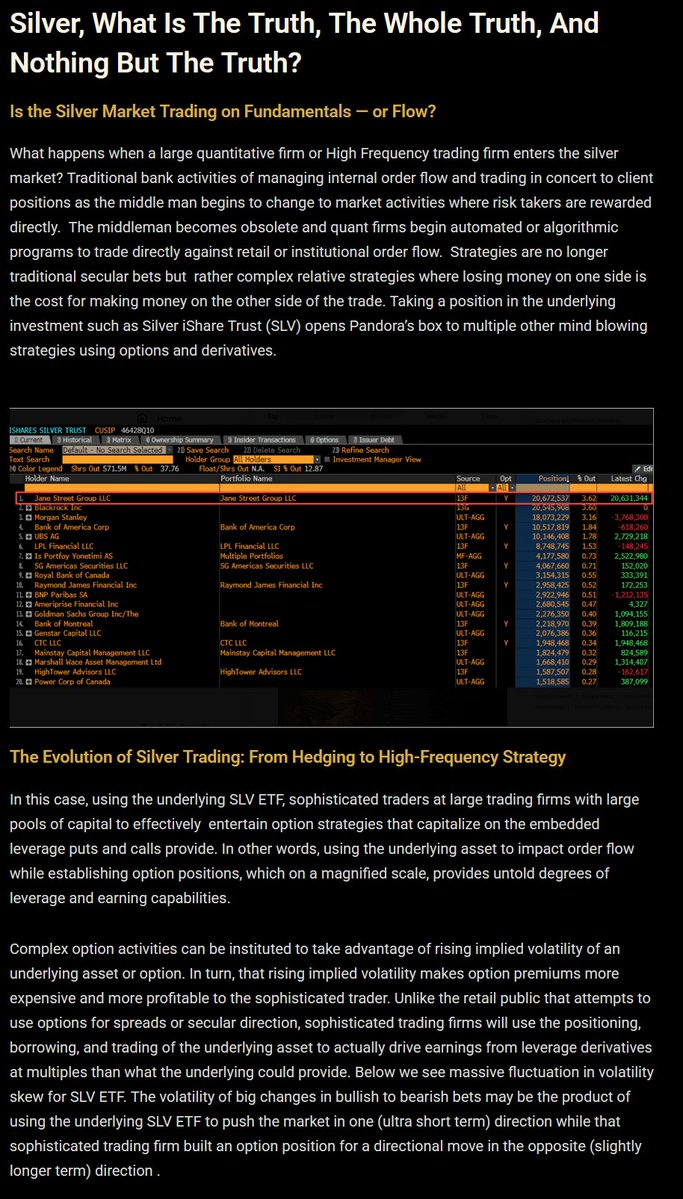
SLV ETF ALERT
Silver, What is The truth, the whole truth, and nothing but the truth?
Is the Silver Market Trading on Fundamentals — or Flow?
MUST READ
Below is part of my article I just wrote that provides more color on the possible effects of Jane Street's involvement in SLV ETF. During the 4th quarter of 2025
Jane Street's position in SLV ETF increased by 50,084.59%.
To see the whole article, click here
https://t.co/b9yyv7Zfuv
Please repost and comment. I am curious if this article is revealing the seemingly deregulated atmosphere we are seeing in many asset markets today.
Always follow the money.
Saudi Arabia wanted Trump to attack Iran.
They gave Trump’s son-in-law a $2 billion investment, plus $25M per year, and a $7 billion real estate deal for Trump.
The UAE wanted Trump to attack Iran.
They gave the Trump family $500 million, plus $200M to Kushner, and bought $2 billion in crypto from Trump’s crypto company.
Trump sent the US to war, and soldiers to risk their lives, because of bribes.
https://t.co/zwicAPr7N7
I finally exited all my FnO positions today after a looong time! When I'm sitting on cash, I manually go through hundreds of stock charts to find the next set of promising setups I can deploy my cash into.
As part of my ongoing endeavour to open source as many parts of my trading toolkit as possible, I'm sharing a @screener_in query which is one of the sources from where I get my initial stock list.
https://t.co/9QoXNkvcOY
I download this list as a csv and then use a helper script to convert it to a format that can be uploaded into @tradingview. You can find that here
https://t.co/kGyJEFRuE1
Just to clarify, the folks at screener haven't paid me anything for this post nor do I expect any freebies for this in the future.
I am very proud of the routines I have developed over these last few years to streamline my trading process.
If there is any selfish motive here, it is to see that these tools get used far and wide, and to hear that they have benefited others on their own journeys 🙂
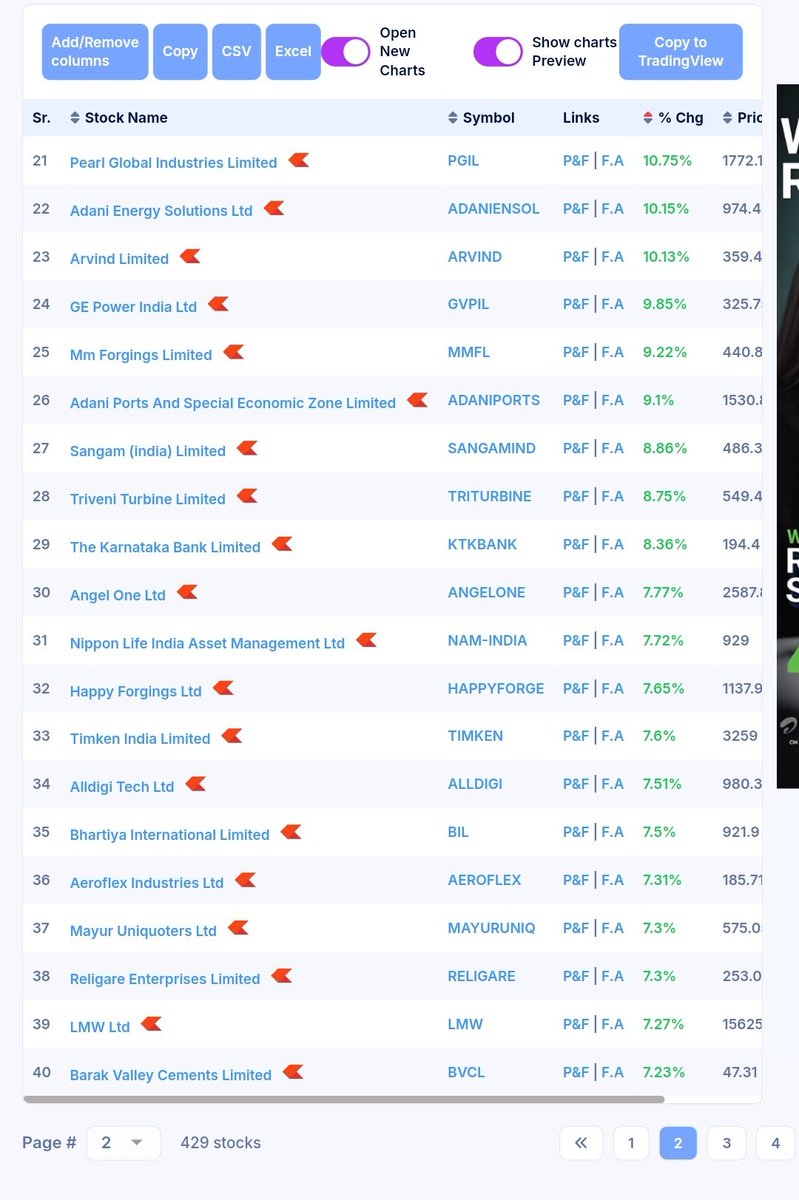
𝗜 𝗰𝗿𝗲𝗮𝘁𝗲𝗱 𝗺𝘆 𝗼𝘄𝗻 #Scanner 𝗳𝗼𝗿 𝗿𝗲𝘃𝗲𝗿𝘀𝗮𝗹 𝙒𝙞𝙩𝙝 𝗯𝗿𝗲𝗮𝗸𝗼𝘂𝘁 𝗦𝘁𝗼𝗰𝗸𝘀 𝗦𝗰𝗮𝗻
👉This scanner is based on a triangle pattern breakout (Reversal pattern)
To get this scanner Like, comment "Scan" .. I will send you the Scanner in your DM.
👉 After 200 Like ❣️ Scanner share my Telegram channel 🔗 https://t.co/80rsoXrmQS
You must follow me so I can DM you!
#Multibagger | #StocksInFocus | #NiftyMidcap100
Got many comments asking for scanners.
Here’s the list of scans I use.
I use different scans based on the situation -range expansion, range contraction, IPOs, and scans for next-day trades.
These scans won’t pick 1–2 stocks for you. In a good market, you may get 500–800 names.
You still need skill and setup clarity to choose trades.
Use them, tweak them, and make them your own.
Scans are simple. The real edge is behavior, discipline, and process.
1. https://t.co/6C29BUtQvS
2.https://t.co/iCTygzeMsX
3. https://t.co/GMaOfNa2kl ( If you are only Looking for Range Contraction and fine if you miss some Setups )
4. https://t.co/UOu0ZRNvKQ ( For Ipos )
🚨 THIS IS NOT NORMAL. AT ALL. 🚨
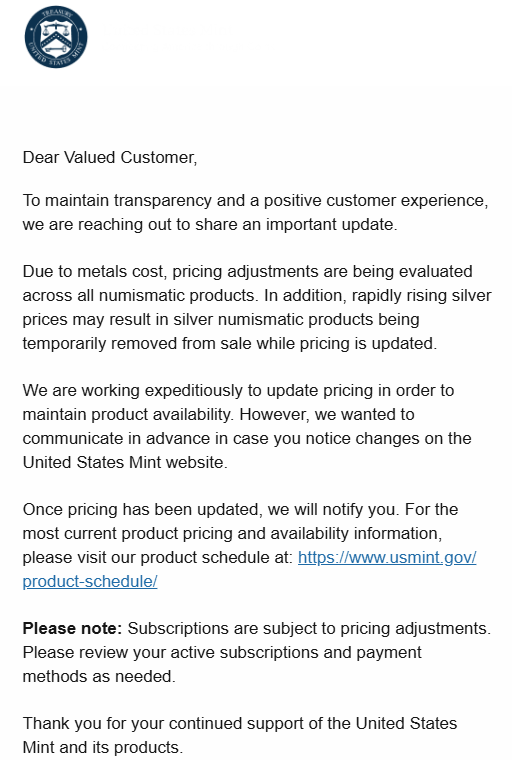
The U.S. Mint has SUSPENDED ALL SALES of silver numismatic products.
Read that again.
The official mint of the United States just said:
❌ Prices are moving too fast
❌ They can’t keep silver priced accurately
❌ Products are being pulled until repricing is done
The U.S. Mint does NOT speculate.
They source REAL, physical silver, not paper contracts.
When they pause sales, it means physical demand is overwhelming the system and the paper price is no longer telling the truth.
This is how every silver squeeze starts:
• sales halted
• premiums explode
• availability vanishes
By the time this hits headlines, silver won’t feel “cheap” anymore.
This isn’t a top signal.
This is a supply-stress signal.
Know What You Hold!
#SilverSqueeze #KWYH
The number of full-fledged Free and open-source software (FOSS) products and initiatives coming out of the 4th Phase, JP Nagar (Zerodha Tech), must be unprecedented for a team of its size globally.
All of these projects started as a way to solve problems we faced internally and were then open sourced. We use them at scale in our stack, and several large organisations and even government departments globally use many of these tools today.
Read more, check the website in the comments.
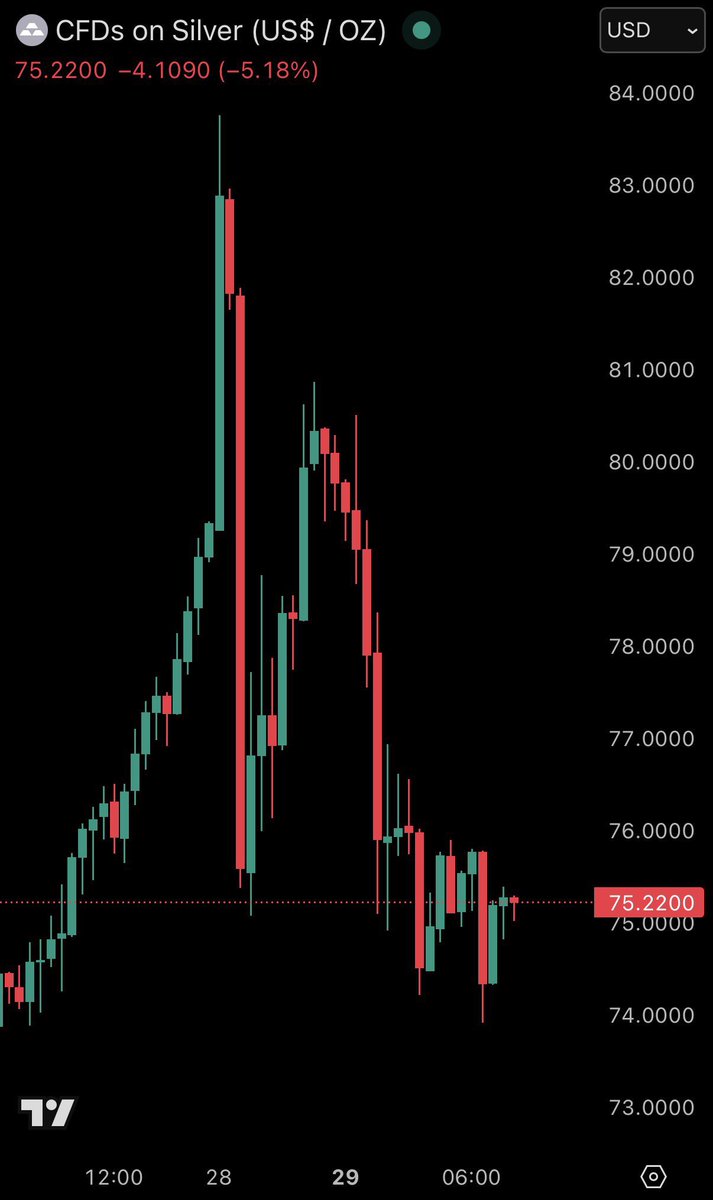
🚨 SILVER DOWN 10% IN MINUTES. NOW WE KNOW WHY 📉
That violent 10% candle wasn't retail selling. It was a forced liquidation event.
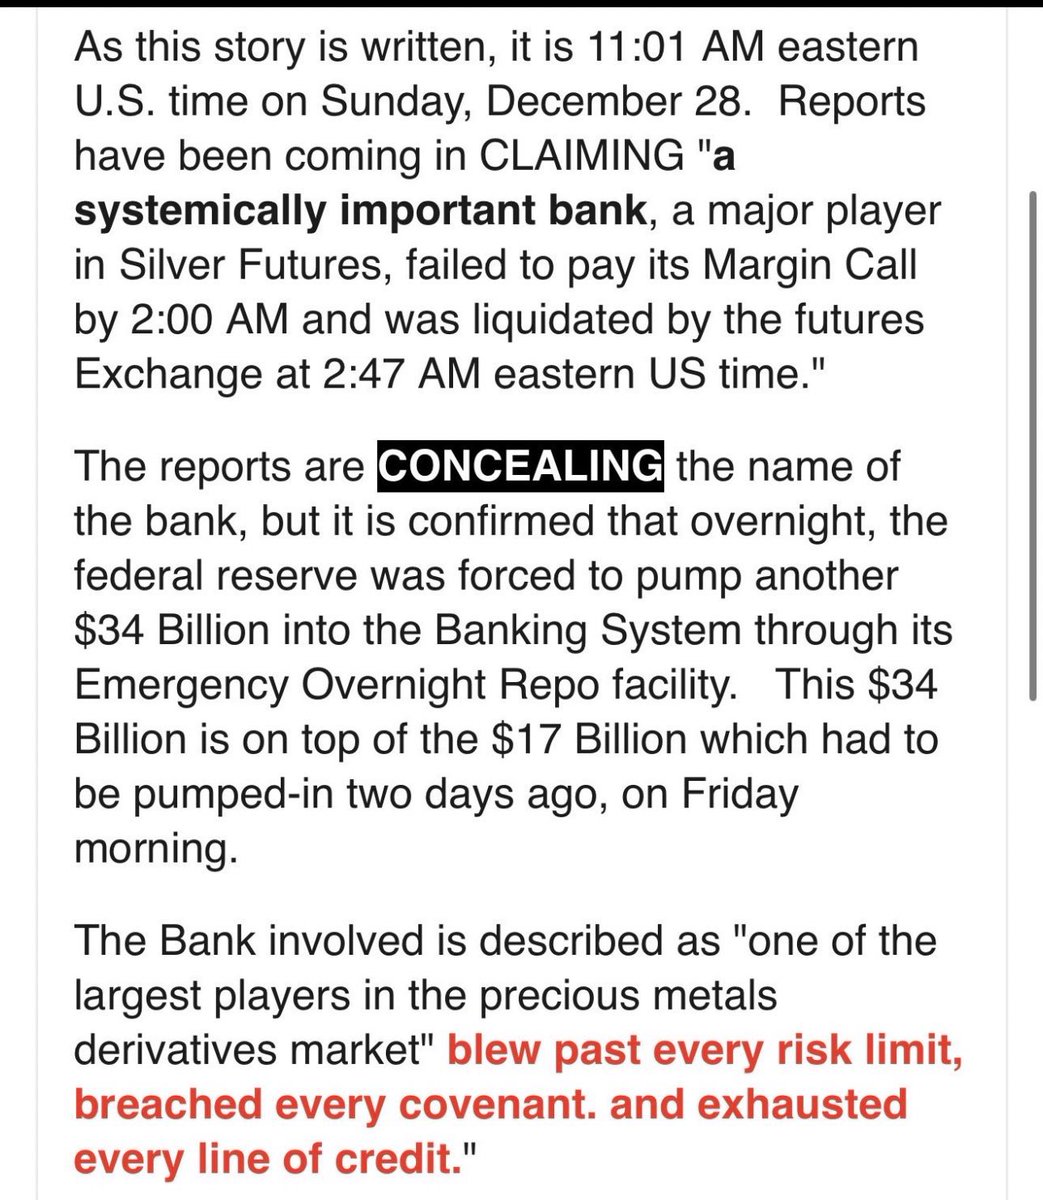
News confirmed: A major bank blew up its Silver Futures position at 2:00 AM from a missed margin call.
$34B Emergency Fed Injection + Forced Liquidation Algorithm triggered.
When a whale this big gets taken out, the market dumps everything to cover the hole. That’s why we saw the 10% wipeout.