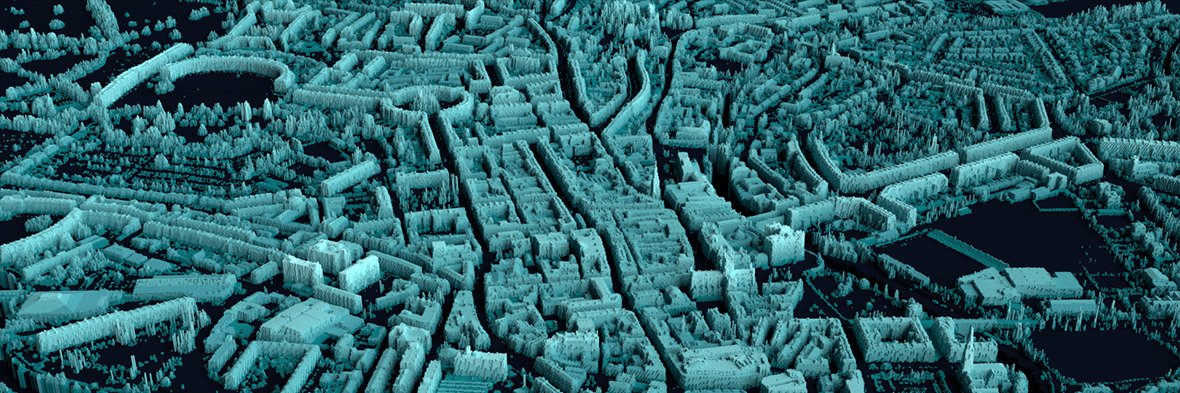
@maticodes @EnvAgencyGeomat@ephtracy I used FileToVox with LazyGUI to generate the vox file from the lidar/buildings image, using the buildings colour image as the source of colour. The vox file can then be dragged into MagicaVoxel and rendered!
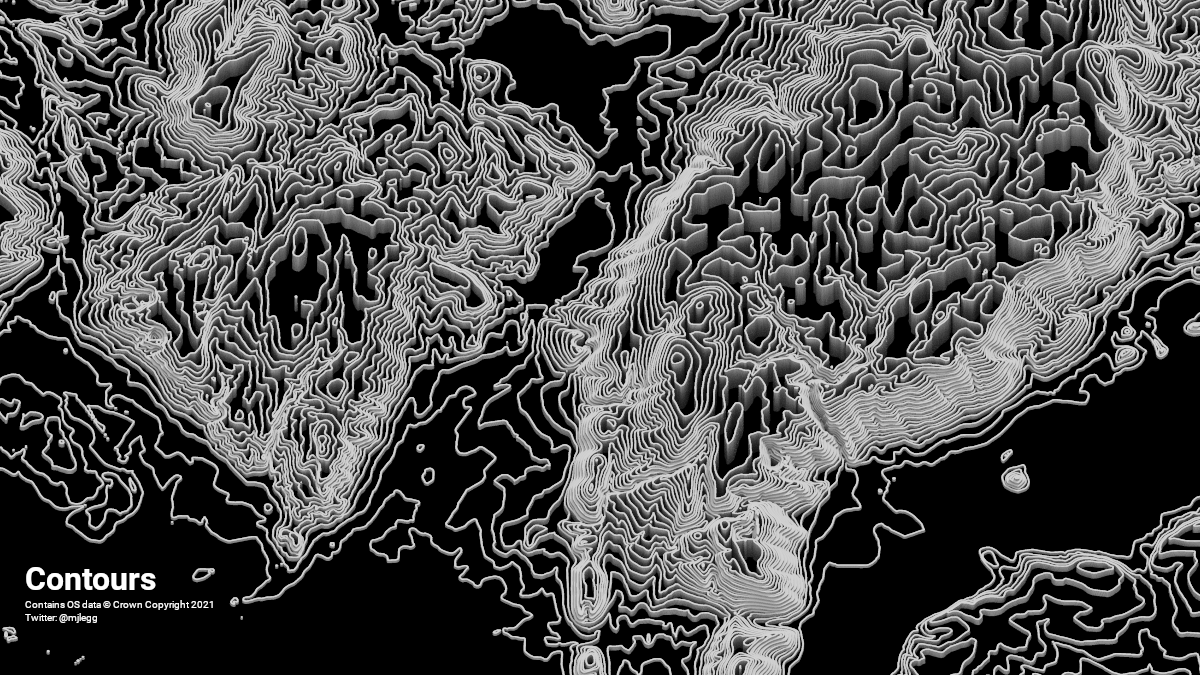
#30DayMapChallenge Day 9: Monochrome
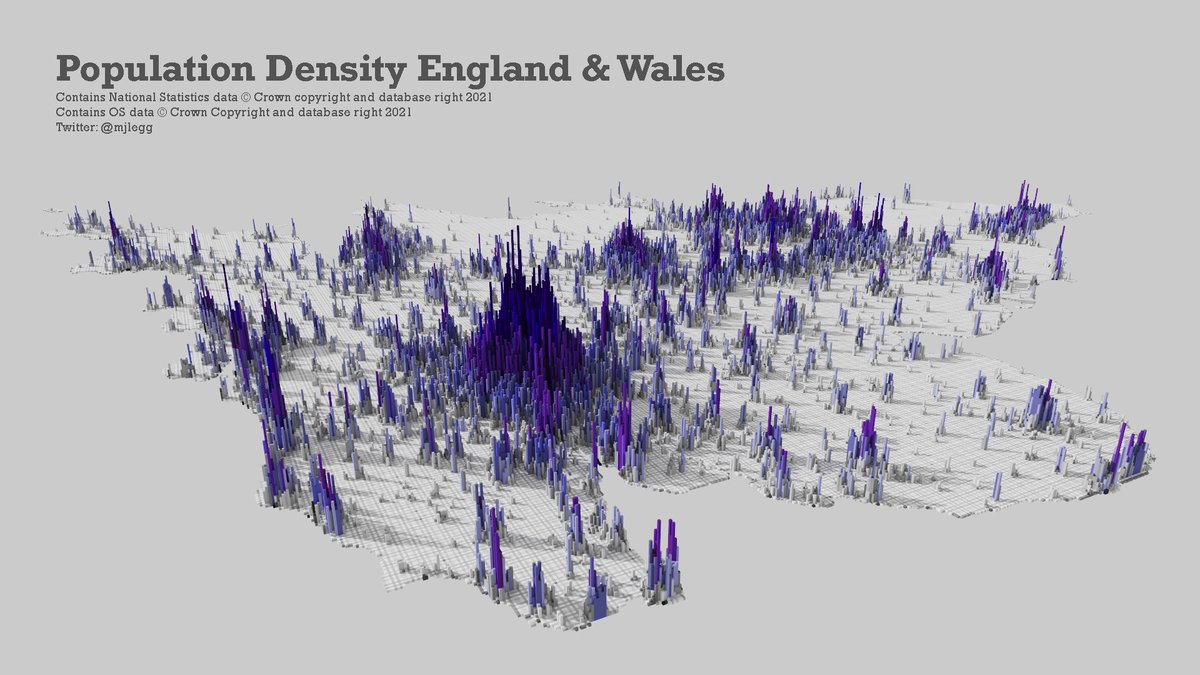
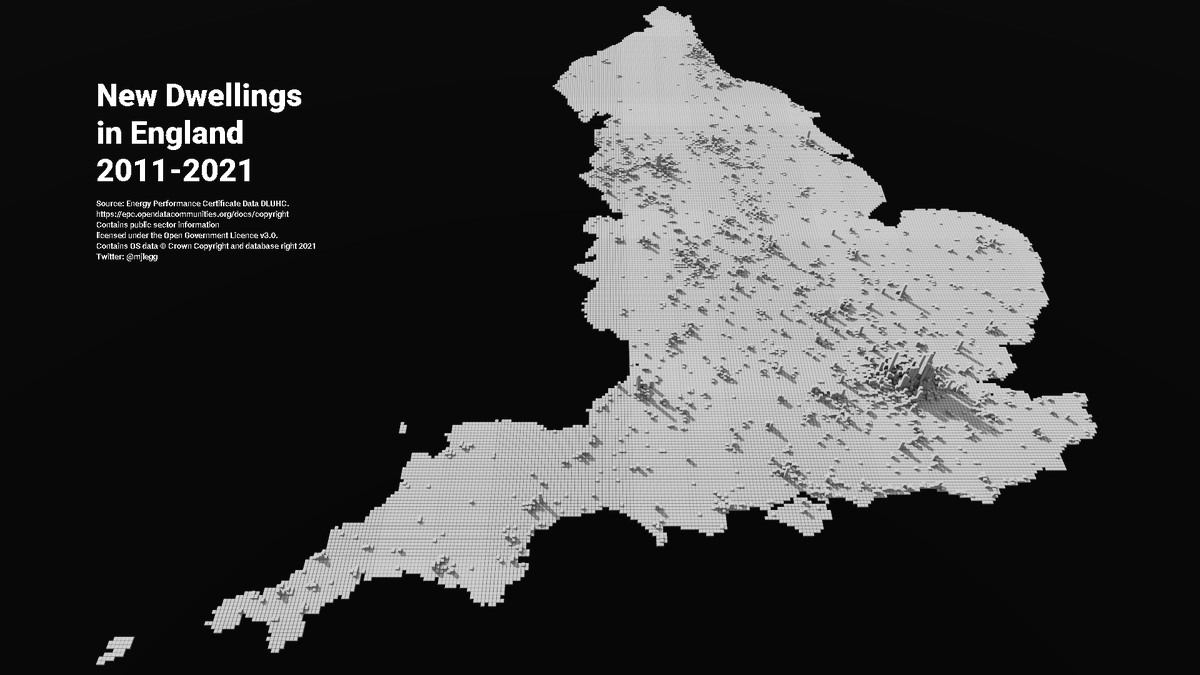
Energy Performance Certificate New Dwellings in England 2km grid map. Data source https://t.co/9QL5f0j2Jb. Using #QGIS and #Aerialod@ephtracy.
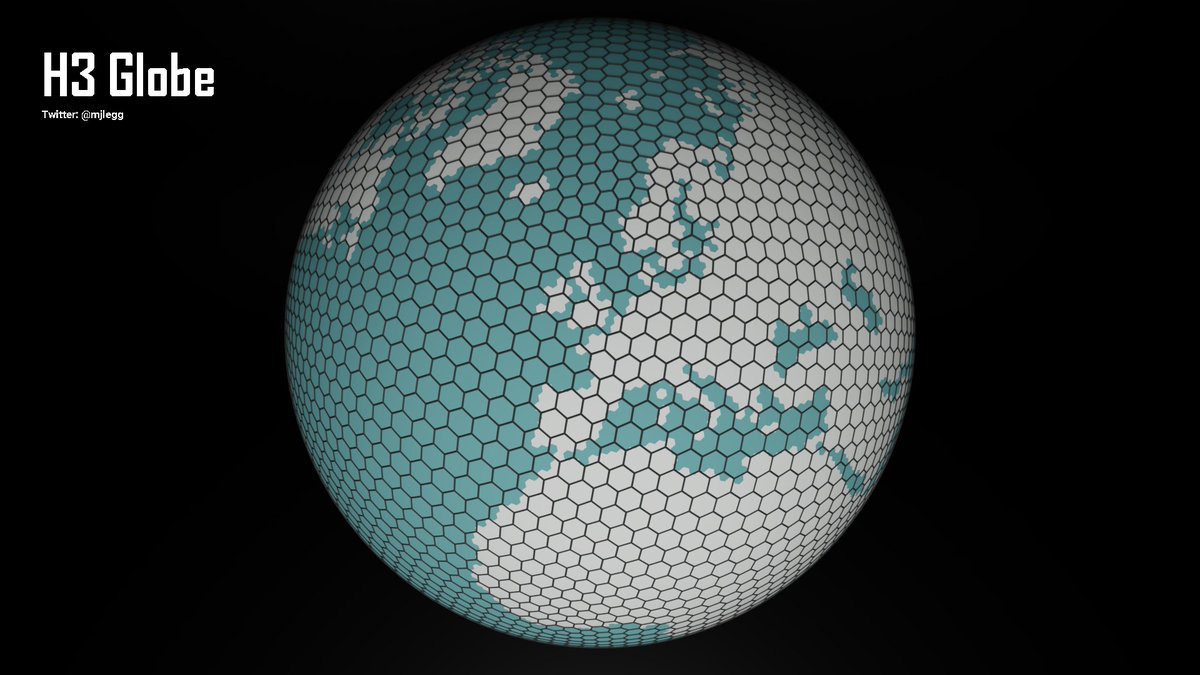
#30DayMapChallenge Day 8: Blue
Energy Performance Certificate New Dwellings in England 2011 to 2021 hex map. Data source: https://t.co/9QL5f01rkB. Using #QGIS.
#30DayMapChallenge Day 3: Polygons
Largest and smallest English district, borough & unitary authorities by area - Ordnance Survey Boundary-Line data using #QGIS
@ricardofrance I extracted the dot colour pattern from an image using Python PIL and then generated the dots in Blender from the colour pattern data using Python.
@mspry_ @LichfieldsUK@HarryJBennett Really interesting article. ONS Nomis major towns and cities pop estimates appear to be based on output areas rather than MSOAs.
#30DayMapChallenge Day 25: COVID-19
COVID-19 hexmap: weekly number of cases by English Lower Super Output Areas (LSOA) using Blender #b3d. LSOA counts between 0 and 2 are not included. Data at LSOA level no longer published. Original source: https://t.co/EykkpvCUOA