Professor of Mathematical Finance at UC Santa Barbara. CFMAR Co-director. Working on renewable energy, computational finance & ML in Actuarial Science.
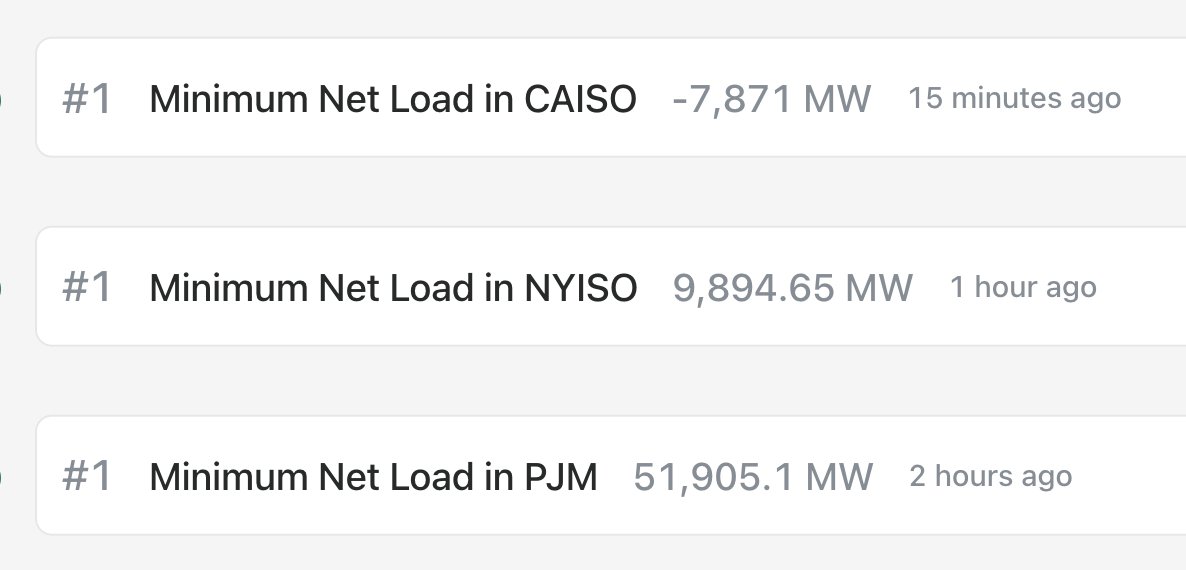
The day of minimum net loads: all three of CAISO (West), NYISO (New York) and PJM (Mid Atlantic+Midwest) set record low net loads today. In CAISO, thanks to the batteries the grid can go almost -8GW nowadays.
@xiaowang1984 Good analogy. Thus for a hybrid PV+battery asset, the marginal cost is no longer zero but whatever is the opportunity cost of selling power say later in the evening.
Crazy congestion in CAISO right now along Moss Landing-Metcalf Path 15. Prices are $-60 in Monterey Bay area and above $400 in Gilroy and Morgan Hill, leveling off as you approach San Jose. @grid_status
MISO set a new renewable generation record yesterday, over 39GW. This is a leap of 2GW+ compared to old record set 5 weeks ago.
For comparison, ERCOT's renewables high is 47GW set in June 2025 and CAISO's high is 29GW also from June 2025. MISO might catch ERCOT next year...
Just three days after the previous record, SPP solar gen broke the 2GW barrier on April 3. The new all-time solar generation record of 2085 MW is 400MW higher, equivalent to a 17.1% jump. I am sure multiple further records are forthcoming in the next few weeks.
SPP is finally adding solar generators. There have been no fewer than 19‼️new max solar generation records set in SPP in 2026. With the days getting longer, more records are definitely forthcoming. With peak solar gen of <2GW, SPP is still very far behind neighboring MISO & ERCOT
CAISO has surpassed 12 GW of discharging this past Sunday. At that peak discharging (~7pm), batteries were providing nearly 44% of total power. See the near-perfect complementarity between solar falling off & storage picking it up below, erasing the vast majority of evening ramp.
A tell-tale sign of increasing share of renewable generation are new records of *minimum* net load. Today it was MISO whose all-time lowest net load decreased by 2+ GW. Last week it was ERCOT, where net load trough is approaching zero. All top-10 lows were set in the past month.
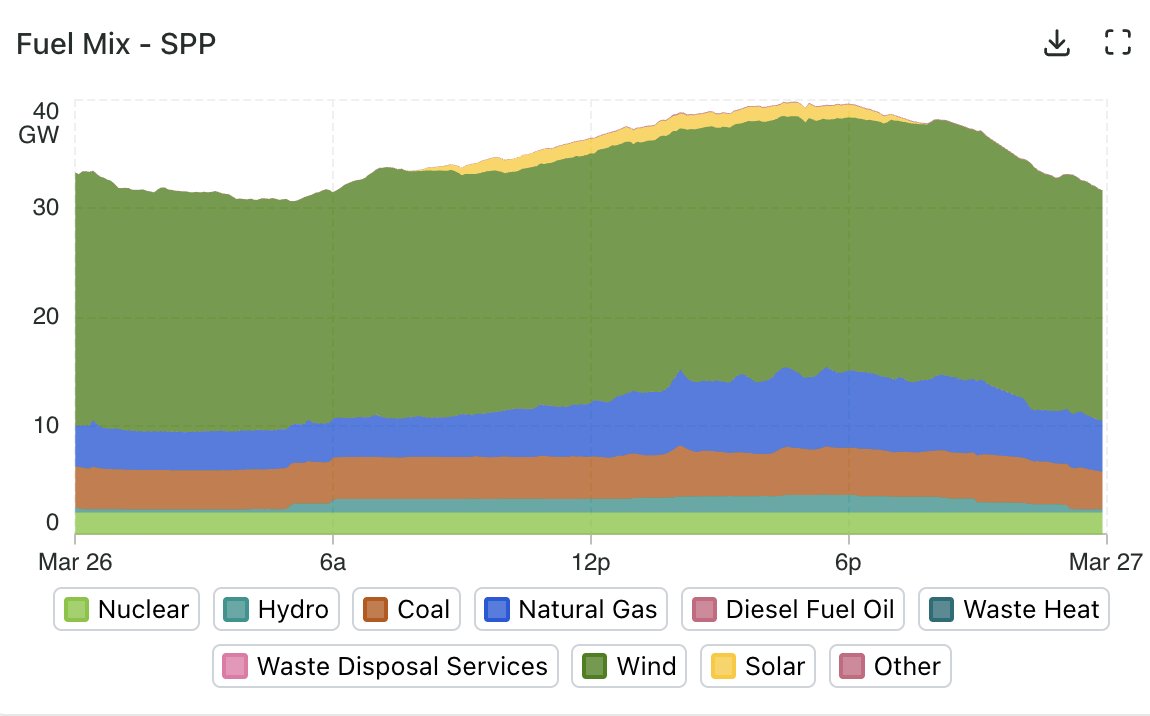
It's been windy in the High Plains, which is very good for renewable generation in SPP. Wind has supplied 58%-70% of load throughout the past 36 hours, quite exceptional consistency (note how little solar there is -- it was practically nonexistent in SPP until last year)
One of the longest-standing renewable generation records fell last night: CAISO had a new all-time-high Wind output of 6654 MW, beating the old record set way back in May 2022! You wouldn't know it from the gen mix: even yesterday wind was dominated by solar & batteries.
Wild RT power prices in SPP North Hub (covers MN, IA, SD, ND and NE) on Friday 1/23, with repeated spikes of multiple hundred $$. Note the *negative* RT prices in the morning when thermals were already on but demand was not yet there. For comparison, typical SPP price is $30/MWh.
@JesusFerna7026 100% agree that WPP fertility projections are inadequate. They entirely disregard recent trends. For many countries the WPP forecast is basically the latest TFR number, flat, no trend. Echoing @Noahpinion call, we need much better statistical models for future TFR.
@simongerman600 These projections are from UN WPP. The UN does excellent work on mortality forecasts, but their fertility projections which assume essentially a constant level of future TFR or trend reversal to 1.5 TFR, are completely decoupled from reality. Entirely disregarding past trends.
@t1m_apple Agree, but these effects play out on the scale of days and weeks, not the minutes in the above screenshot.
Price overshoots (in either direction) following significant geopolitical news are well known, driven primarily by market microstructure effects.
An event-triggered financial "cliff" if there ever was one. Reaction of Bitcoin to Trump's Europe tariffs. As usual, happened over a weekend, so BTC was probably the most liquid market trading. Note the usual overreaction in the first few mins & the gradual partial recovery.
@JesusFerna7026 I find this multi-decade delay effect where we know how the size of the labor force will change for the next 20+ years fascinating. Any macroeconomic models that explicitly capture it?
@JesusFerna7026 While this recent fertility collapse has huge implications, these are mostly 30-50 years in the future. In the near term a bigger impact is coming from the end of the 1960s pop boom: Chinese births were 29M in 1963 and only 18M in 1976, creating an ongoing wave of retirements.
🌞Solar trifecta day: today 7/24/25 we had all-time highs in solar generation across the whole country: new record in CAISO (West Coast), ERCOT (Texas) and second highest on record in ISONE (New England)! Exceptionally clear skies everywhere in the U-S-A See @grid_status