Altın Sertifikası (#ALTINS1)
Borsadan hisse alıp satar gibi işlem yapabildiğiniz, altına yatırım imkânı sunan bir enstrüman. 100 adet alındığında %99,5 saflıktaki 1 gram 24 ayar altına denk geliyor — istenirse fiziki teslimat da mümkün.
En çok sorulan soru: Değeri ne olmalı?
Hesaplama oldukça basit:
Gram altın fiyatı (GLDGR) × %99,5 = ALTINS1 teorik fiyatı
Hesaplamakta zorlanırsanız Matriks Mobile'da ücretsiz #ALTINI koduyla takip edebilirsiniz.
Peki neden teorik değerinin üzerinde işlem görür?
Normal koşullarda %5'e kadar prim makul — iki temel nedeni var:
1. Makas yok. Kuyumcudan alırken ödediğiniz alım-satım farkı burada bulunmuyor.
2. Fiziki teslimat imkânı. Sertifika, serbest piyasa altın fiyatlarıyla hareket ediyor. Güncel koşullarda gram altın serbest piyasada zaten %3 primli seyrediyor; üstüne %2 işlem maliyeti eklenince normal dönemlerde ~%5 prim olağan karşılanabilir.
Anormal talep dönemlerinde prim açılır
Türkiye'de altın ithalatında aylık kota kısıtlaması var. Halkın altına yöneldiği dönemlerde kota üzerinde talep gelince serbest piyasa fiyatları global seviyelere göre %7-8 prim yapabiliyor, kuyumcular makası açıyor. Üstüne altın fonlarına da talep artıyor — bu fonların en sevdiği araçlardan biri de ALTINS1. Böyle dönemlerde prim daha da şişiyor.
Özet: %5'e kadar prim normal, üzerindeki primler ise aşırı talep dönemlerine özgü geçici sapmalar.
Temel Kavramlar
#GLDGR — %100 saf gram altının global piyasa fiyatının güncel kur üzerinden TL'ye çevrilmiş hali.
#SGLD — Serbest piyasada işlem gören %100 saf gram altın fiyatı.
#ALTINI — GLDGR × %99,5 ile hesaplanan; %99,5 saflıktaki 24 ayar altının global piyasa fiyatının güncel kur üzerinden TL'ye çevrilmiş hali. ALTINS1'in teorik değerini ifade eder.
Yeni Taramamız;
W Dip (İkili Dip) Formasyon Taraması
Piyasada yapılan en büyük hata, henüz dönüşünü kanıtlamamış hissede "ucuz" diye inat etmektir.
Bizim işimiz ucuzu değil, "güçlenmeye başlayanı" bulmak! 🚀
Geliştirdiğim bu tarama modeli tam bir "Trend Ateşleyici".
Fiyatın kritik ortalamaları (SMA 50) kırıp geçtiği, ADX ile trendin şaha kalktığı ve artan hacimle alıcıların masaya yumruğunu vurduğu o altın anı yakalıyor.
Ekrana bakarak dip aramak kumardır; doğru teknik filtreler ve hacim onayı ile işlem yapmak ise strateji. Sinyale güven, disiplini bozma. 📊🔥
✅ Fiyat > SMA 50 & SMA 50 > 200 (Trend onayı)
✅ RSI > 50 & MACD > Sinyal (Boğa momentumu)
✅ ADX > 20 (Yataylık bitti, trend güçlü)
✅ Hacim > 30G Ortalama (Para girişi teyidi)
#xu100 #borsa #trade #pinescript #tarama #tradingview #xauusd #xagusd #btc #samat #ktlev #ecogr #beste #tly #tera #tehol #pekgy #eregl #sise
If you hold this for just 1 minute a day, you could
Fix forward head posture
Reverse slouching and improve posture
Relieve lower back discomfort
Open up your chest and shoulders
Stand taller and move better
APPLE IS CHARGING YOU $2.99/MONTH FOR SPACE THAT'S ALREADY ON YOUR PHONE.
You don't need to pay it.
I freed 47GB in 10 minutes without spending a cent.
Here are the 5 steps to copy:👇
TradingView Hisse Takipçisi — Tarama Reçetesi
Strateji özeti:
Uzun vadeli hacim çapasının (15 Mart 2020 / COVID dibi) altında olup, kısa vadede toparlanan ve haftalık momentumu yukarı dönen hisseleri bulmak. → "Dipten yeni toparlanan değer" taraması.
Temel sorun ve çözüm:
AVWAP screener'da yok; en uzun ufka ulaşan tek araç SMA. Ama tek bir SMA periyodu, farklı yaştaki hisseler için çalışmaz (2020 sonrası IPO'larda uzun SMA boş döner ve hisse sessizce elenir).
Çözüm: IPO offer date filtresiyle evreni yaşa göre kovalara böl, her kovaya uygun SMA periyodunu uygula, sonuçları birleştir.
Dip Taraması Kayıt Linki:
(Kova 2 ye ayarlı)
https://t.co/syOBBYzCGe
Beğendiysen
Takip + ❤️ + 🔁
My Daily Routine on @TradingView Screeners: Discovering Daily Swing Setups Through Multiple Screening, Watchlist Management, and Tightness Screening within Watchlist.
Note: This 3-minute video is played at 2x normal speed from real-time.
Upon uncovering the screening feature within the 'Watchlist' on @tradingview v2 screener, I would like to demonstrate how you can optimize your daily screening routine, efficiently manage your watchlist, and identify potential setups from within it.
1. I utilize a set of 12 swing trading scans to transfer results into individual watchlists, along with two daily scans specifically designed to filter setups within all my watchlist. However, most of these scans are executed on a weekly basis due to the repetitive nature of daily results. But I will showcase the utilization of all screens, including each parameters.
2. Every screen result goes into their individual watchlist. eg. 'Strong Movers >10B Mcap', 'Strong Movers <10B Mcap', 'Fundamental (CANSLIM)', 'Post Earnings Continuation Base', 'Daily Tightness'. I also have watchlist that are already established for 'IPO Base' , 'China Top 30' MCap, 'Short Float', 'Back Watchlist'.
3. After transferring all screening results to individual watchlists, I introduce two additional scan parameters: 'Watchlist Scan Price Above/Below EMA Below 5%.' These parameters aim to identify tight swing trading setups within a range of above and below 5% of the 5-day Exponential Moving Average (EMA). To consolidate the filtered results from all watchlists, you will need to create a new watchlist. In the video, I label this watchlist as 'Scan Result.' This is the only watchlist that I will refresh weekly (delete and rebuild again for the start of the week).
You're not obligated to adhere to my screening parameters. If you already have your own set of screens, what I'm illustrating is simply how you can optimize your time more effectively with the introduction of 'watchlist' screening. While this feature offers significant time-saving benefits for daily use, I firmly believe it remains crucial to dedicate time during the weekend to thoroughly review and analyze stocks, identifying potential industry group setups one chart at a time. I would review all the stocks in each individual watchlist on each Saturday.
I hope this will be helpful in your process.
If you have missed the previous discussion, please find the link below.
https://t.co/HXtCAVgBtO
I couldn't agree more with @1ChartMaster!
Every night I run a scanner looking for recent earnings gappers, large movers, and stocks showing unusual relative strength. If they belong to a strong theme, sector, or narrative, they immediately go onto a watchlist where I simply wait for tightness and a setup that fits my system.
This has genuinely been one of the biggest drivers of my momentum this year.
1) Find early strength.
2) Build a large list.
3) Be patient.
4) Execute.
5) Pay-tience.
& repeat!
EMLAKÇININ “GÜNEŞ BANYOSU YAPIYOR" DEDİĞİ EVİN ASLINDA KÖR CEPHE ÇIKMA DRAMI BİTTİ
Birisi binaların üstüne düşen güneş ışığını saat saat simüle eden bir harita yapmış.
Evi tutmadan önce adresini giriyorsun.
Kışın sabah 8'de salon güneş alıyor mu, yoksa karanlıkta mı oturacaksın ekrandan görüyorsun.
Kendi ev arayışından dertlenen bir builder'ın elinden çıkan şahane pratiklik.
Link yorumda 👇🏻
Hayırlı pazarlar herkese x de birçok tw taramaları dolaşıyor. Birçok büyük hesap zor tarama yapıp ama bir işe yaramayan taramalar paylaşıyor. Ben size hem taramayı hemde mantığını anlatır, sizi çakma hostadlara bırakmam.
1. Tarama
Açılış vurgunu
Mantık daralan ichimuku bulutu ve
Ema 5/13 kırılımi yani direnç aşmak üzere olan .
Kullanım mantığı sabah 10.01 de gelen hisseleri en mantığıniza yatana bakıp direnç kırdığı anda almak
Kullanım saatleri 10:01 /13:00 arasıdır.
Saat 13:00 sonra ki gelen hisseler backtest yapar genellikle o hafta yine yükselir.bu taramanin mantığı aynı gün al sat tır .
Bu en basit taramalarim dan biri . Daha devamı gelecek bir sonraki tarama paylaşımı salı günü olacak hacim bazlı bir tarama olacak
The airline lost my bag for 72 hours.
They handed me a $50 “courtesy” voucher at the baggage desk and smiled like they’d done me a favor.
I kept the voucher. Then I opened my laptop and used a 1999 international treaty they never mention at check-in.
Total recovered: $1,650.
Here are the three legal weapons most passengers never know they have.
My Favorite Weekly Chart Setup: The "Character Change"
This is my go-to setup for getting into new uptrends early, and it’s something I use only on weekly charts.
The CC (character change) is all about patience and waiting for clear evidence that the trend has shifted.
⚠️ If you’re looking for quick trades or need to be active, this might not be for you, because these require you to sit after you get in for a long time and let it do it's thing.
Why Weekly Charts?
Weekly charts smooth out a lot of the noise you see on daily charts. They give you a bigger picture and help you see the trend more clearly.
What Is the "Character Change" Setup?
This setup is about recognizing when a stock is transitioning from a long downtrend to the early stages of an uptrend. It’s all about waiting for specific signals on the weekly chart that show that it is highly likely the long-term trend is now up.
Here’s what I look for:
1. First Higher Low
After a long downtrend, I look for the stock to make a higher low on the weekly chart. This alone isn't enough but it's our first piece of evidence that something might be up.
2. HUGE Volume with a Price Pop
The other thing to look for is a big surge in volume with a strong price move. This shows real institutional interest. This is our second piece of evidence. You have a higher low + it's first massive push. After this I have confidence the birth of a solid new trend is likely in place.
Also the 1st or 2nd above can happen in any order you just want to see both.
3. New 10 Week respect
The way you get a low-stress entry with incredible R/R is by waiting now that you have the evidence of a true CC on your side. The 3rd piece of the puzzle where you can enter with extremely low risk if it doesn't work is when you see the stock start to respect the 10-week moving average for the first time.
Example 1: $APP
Let’s look at APP, which had a huge run after showing this setup and my second best trade of all time.
1. Volume Pop: First, I noticed a big volume spike, but I didn’t jump in just because of that alone, not enough evidence.
2. First Higher Low: After the volume pop, the stock pulled back a bit and made a higher low. That’s when I got interested. As it made that higher low, it started respecting the 10-week moving average.
3. Holding the 10-Week: It then resumes its move being supported clearly by the 10 week again. That’s the final confirmation needed.
APP took time to develop this setup. Even though it might look like dumpster diving, since these are weekly charts, the downtrend is long over before it becomes a buy. From there, it just kept riding the 10-week line up , giving you multiple chances to add to your position if you caught it or many chances to get in.
Example 2: $PYPL (currently developing)
PayPal was dead money for a long time, making lower lows. Then early this year we started developing a CC.
1. Higher Low: This grinded sideways but still ended up being a big higher low.
2. Volume Pop: Here we get a big price push on volume. Technically we had a few before the higher low was confirmed, and an entry could have been established after the higher low because the risk is so low. But this was the clear Volume pop.
3. New 10W Respect: This is final evidence for me, off the volume pop the weakness is supported by the 10W for the first time. Super low risk entry and you can see if this is a real long-term trend then we are still very early.
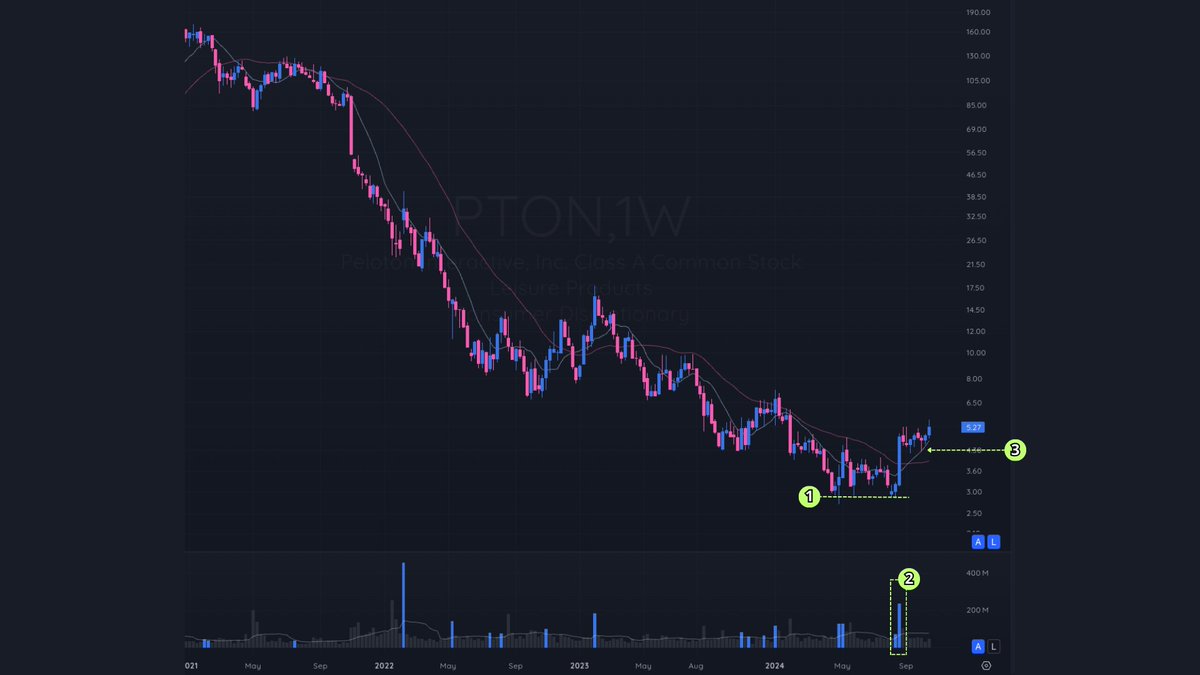
Example 3: $PTON (very early, still developing, and new position)
Peloton had been stuck in a downtrend for over two years, so I didn’t even consider buying until it started showing evidence that the downtrend might be done.
1. Higher Low: Instead of breaking to a new low, it held up at a slightly higher level. It’s subtle, but this is a big clue that the character of the stock is shifting. (It was kind of a retest of the same low, not much of a higher low, so you can argue #3 on the chart is also the first higher low. Doesn't matter, by 3 you have all 3 pieces of evidence.)
2. Volume Pop: Next, a significant volume spike paired with a strong price move. But I don’t buy just because of a volume spike—I need more confirmation.
3. Trading Tight into the 10-Week Moving Average: After the volume pop, PTON started trading tightly near the top of that move and right into the 10-week moving average. This is what really got me interested because even if it fails, I can't emphasize enough.... the R/R for these types of setups is off the charts.
The big thing here is patience. I don’t jump in while a stock is still in a downtrend. I wait until it’s made a higher low, shown a volume surge, and started respecting the 10-week moving average. By the time I get in, the downtrend has usually been over for a while. I’m letting the stock prove itself first.
Quick Recap
Here’s what makes the character change setup work:
1. Higher Low on the Weekly: Signals the stock might be done making new lows and could be shifting to an uptrend.
2. Volume Pop: A big volume spike with a price move. This tells you that there is now real interest in this name and adds evidence to support the birth of a new trend.
3. New 10-Week Respect: This helps add further evidence the momentum is on your side and allows you to get in with really low risk if it doesn't end up working.
Remember, this setup takes time to develop. The hardest part is the patience. It is a lot of hands off and waiting but thats also how I like my trades. Low stress.
Less is more!
If you made it here...drop a reply—I’d love to hear your thoughts and questions.