$AMZN getting that break of $256 let’s see if it can push down further here. Wouldn’t shock me if it pulls back some but want to see $256 turn to resistance
$AMZN testing key support at 256. This could be a potential add spot but I am looking for this level to break and try to buy more shares closer to 240.
$NFLX finally starting to play out - been talking about this break of $85.50 and we finally got it. Chart really looks like it can flush. 4hr 8 ema has dragged down to that 85.50 level so if we pullback up to 85.50 and 8 ema would want to see that flush. Think we can see 80
$META continues to push towards this 592 level. Same setup I am essentially looking at with $amzn breaking 256 - I think meta can break 592 and fall down to 560
$AMZN testing key support at 256. This could be a potential add spot but I am looking for this level to break and try to buy more shares closer to 240.
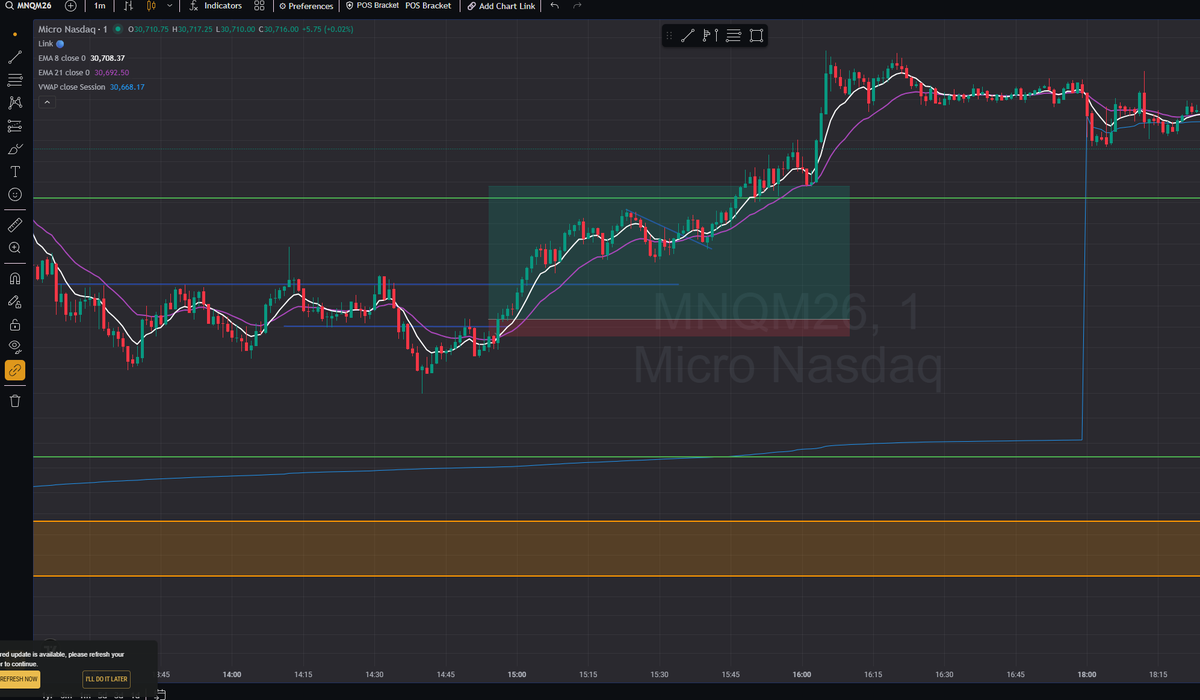
Fantastic move to close the day on futures during live today. Saw a nice 60 points on $nq $mnq. Started to form higher lows and then broke above resistance and had clear targets above and just trimmed along the way for an hour
$UEC seeing a really nice pump - alerted this to the community at $11.90 at test of lows. If this can hold up and start turning the 4hr EMAs into support should see push back into $16.50 and see if it can breakout.
75 point on $nq $mnq for the community and this thing is still rolling to 100+. Pretty straightforward trade - GZ + VWAP on a day with a lot of bullish momentum. Waited for VWAP to be re-taken and took a shot targeting near highs
🧵 Thread on Fair Value Gaps (FVGs)
Let me preface by saying, I use these EVERY DAY on $SPY $QQQ $IWM
1/ What are Fair Value Gaps?
- FVGs are price levels where the market has moved quickly, leaving a gap between the last traded price of one candle and the opening price of the next. They often occur during high volatility phases or after large influxes of buyers and sellers
2/ Identifying FVGs:
- Look for areas where price has moved significantly without retracing back into the previous candle's price range. These zones indicate where the market's "fair value" was disrupted.
$META faked like it finally wanted to break out of this 592.80 - 622.60 range and this came crashing back down. This looks headed straight back to 592.80 and if that were to finally break then there isn't really any support in the way till 560 and if that breaks 520.
$NFLX continues to get stuffed every attempt it tries to push higher. If $85.50 sees a break tomorrow think this can really flush. Have no interest in longs until at least the 4hr 21 ema is broken. If NFLX can get down to $75 things could get really interesting
These new candles been frustating me all day on $nq $mnq but finally got a clean entry. Setup was gz + 21 ema hold targeting a return to the highs for a 40 point win. Def messed up selling at highs cus this ended up going over 100 points but great setup
$HOOD has given us our pushback near the 4hr 8 EMA will buy some shares here and continue to add in if it dips but do not want to miss this move if it just bounces out of here. It was overly extended so this pullback was expected
$HOOD has given us our pushback near the 4hr 8 EMA will buy some shares here and continue to add in if it dips but do not want to miss this move if it just bounces out of here. It was overly extended so this pullback was expected
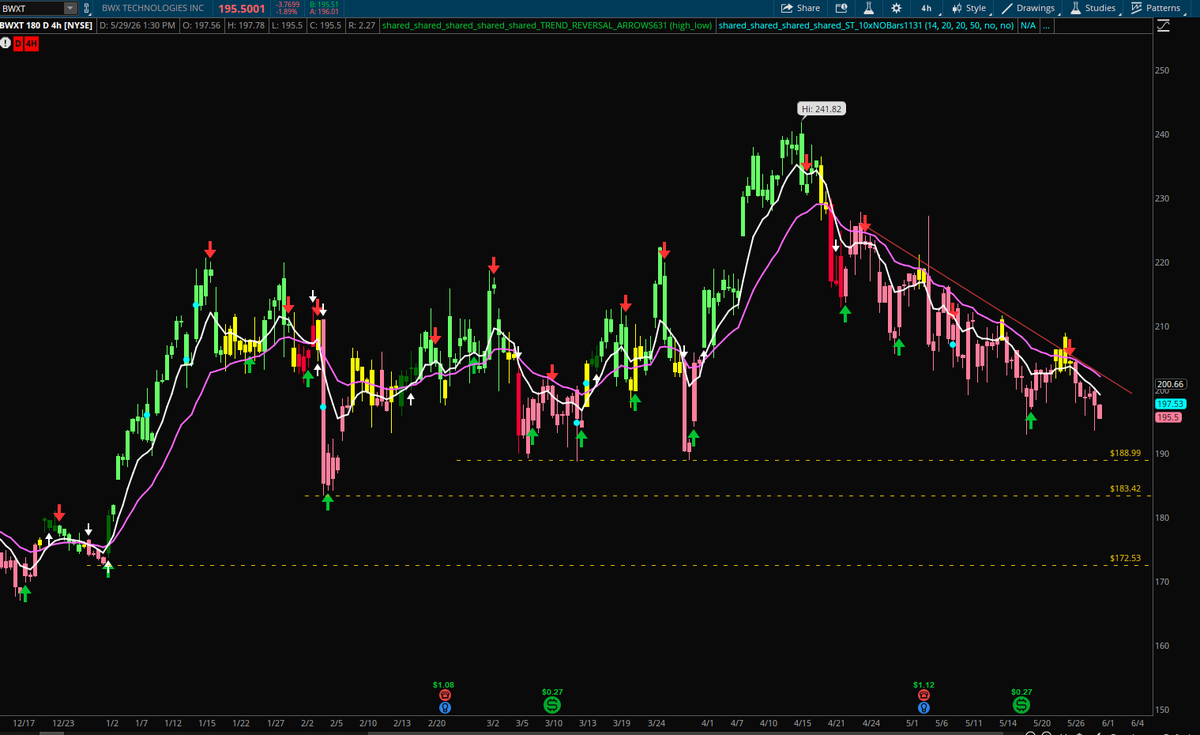
$BWXT has come down to $189 support. If this starts to give out should see a push down to 183 and then could start to target 172. For my longterm port, I am adding shares at this level and will continue to add. https://t.co/43TbapRruM
$BWXT looks like it is headed down to $189 support. I will be looking to add shares if we get there. That being said if 189 breaks, there is room down to 183 and then 172 which I would DCA into.
$NVDA with a nice rejection of trendline + 4hr 21 ema on Friday. It is showing strength in extended hours but not really sold on it yet. If 210 were to give out should see a pullback to 195-200 which would be great spot for adds.