Dica de leitura:
O Poder do Infinito: Como o cálculo revela os segredos do universo
33% de desconto: de R$ 69,90 por R$ 46,20
https://t.co/IRVvROfsaI
"Aviso: este livro é perigoso. Ele fará você se apaixonar pela matemática.” ― Nassim Nicholas Taleb , autor de A lógica do cisne negro
“Uma exposição fascinante de como o cálculo diferencial e integral funciona e por que ele tornou nossa vida muito melhor.” ― Chris Schluep , Saturday Evening Post
O poder do infinito foi um dos finalistas do Royal Society Science Book Prize (2019).
Sem o cálculo não haveria celulares nem GPS. Não teríamos desvendado o DNA nem criado o coquetel que neutralizou a Aids. Não conseguiríamos armazenar milhares de músicas num aparelho que cabe na palma da mão. Os astronautas não teriam acertado o caminho até a lua.
Este livro é um convite a esquecer o temor que a simples expressão “cálculo diferencial e integral” desperta em muitos de nós, até hoje, e embarcar numa viagem eletrizante sobre a construção dessa linguagem matemática.
Quem nos guia é um matemático fascinando pelo cálculo e por seus poderes infinitos.
Voltamos aos gregos e aos primeiros lampejos do que seria essa linguagem misteriosa e maravilhosa. Visitamos os desafios que o cálculo impôs a cada momento da história da humanidade. Com a ajuda do ogro Shrek e do velocista Usain Bolt, entendemos que cálculo não é sobre complicar – e sim sobre simplificar. Sobre fatiar problemas em pequenas partes e reorganizá-los em soluções que evocam milagres e revigoram nosso maravilhamento diante do universo.
Bring your data visualizations to life with animation! The gganimate package extends ggplot2 by adding animation capabilities, making it easy to create dynamic and engaging plots that reveal patterns over time or across categories.
✔️ Dynamic Storytelling: Transform static charts into animated visuals, allowing you to showcase changes, trends, and sequences clearly and effectively.
✔️ Customizable Animations: Control the speed, transitions, and aesthetic elements of your animations, giving you full flexibility to highlight key points.
✔️ Engage Your Audience: Animated graphics make complex data easier to understand, keeping your audience engaged and helping them grasp insights faster.
✔️ Easy Integration with ggplot2: Works seamlessly with ggplot2, so you can animate your existing plots without needing to learn complex new syntax.
The example shown here is from the package website, illustrating how gganimate can transform typical plots into informative animations: https://t.co/GrCEqDQquK
Ready to master ggplot2 and its powerful extensions to make your visualizations stand out? Enroll in my online course, “Data Visualization in R Using ggplot2 & Friends!” See this link for additional information: https://t.co/ztlEzoEDWv
#datastructure #RStats #tidyverse #DataAnalytics #rstudioglobal #DataScientist
O Brasil está queimando!
Você sabia que os efeitos da queima de biomassa desta magnitude na saúde das pessoas é imenso?
Aqui reuno evidência científica produzida no Brasil:
⬆️ Mortalidade
⬆️ Hospitalizações
⬇️ Desempenho escolar
⬆️ Eventos na gravidez e ⬇️Saúde do bebê
Prezados
Permitam-nos um desabafo. Sempre, absolutamente sempre, trabalhamos com muita vontade e com máximo afinco de informar vocês. Mas ninguém, ao menos quem não seja sádico, tem prazer em informar desastre e muito menos prevê-los.
Vocês acham que neste momento não gostaríamos de estar prevendo sol por semanas?
Todos os nossos estão fora de casa. Cem por cento da empresa. Pior, alguns dos nossos perderam seus lares por completo e não poderão viver por meses onde criavam seus filhos até a semana passada.
Vocês acham que nos compadece prever mais chuva ou enchente? Prever mais desastre que toca a nós e aos nossos familiares?
Saibam que todas estas previsões que temos divulgado, que quase só trazem más ou péssimas notícias neste dias, temos escrito com profundo enojo. Exclusivamente por dever de ofício e profissionalismo. Nada mais.
A mesma aflição sobre o amanhã de vocês é a nossa. Com o agravante que, pelo conhecimento antecipado dos fenômenos, temos ciência antes de situações de desastre.
Então, nos cabe calma e serenidade. Não será nesta semana ou na próxima que vamos retomar um mínimo de normalidade. Será um processo bastante longo, difícil, sofrido e muito penoso, mas que, por óbvio, será mais curto se a natureza ajudar, os gestores públicos forem eficientes, e o nosso sentido comunitário e de vizinhança falar mais alto com solidariedade e apoio àqueles que precisam de ajuda em nossas cidades.
Abração.
Povo guerreiro e bravo, cujo santo padroeiro é São Pedro, santo do meu nome.
Estive ano passado viajando ao RS e amei tudo que conheci, passei em Porto Alegre, Rio Grande, Chuí, Barra do Chuí, Santa Vitória do Palmar, Praia do Cassino, Santanna do Livramento e Santa Maria.
Estou rezando para São Pedro e Nossa Senhora Medianeira para que interceda e ajude todo povo gaúcho.
Da Serra aos Pampas, do Litoral à Fronteira.
Força Rio Grande do Sul.
@denise47613384 Oi, esse segundo post é montagem. Sempre chamei o ditador Bin Salman de ditador. Sempre bom checar antes de compartilhar. Aqui o texto original, no qual falo que Lula é hipocrisia ao se reunir com ditador
https://t.co/bs4BODB1Y5
Entra nesse site e se matricule em 3 cursos de R para análise de dados (pode ser inclusive o mesmo conteúdo, sem problemas).
Daqui a um ano...vc volta e me diz a diferença que isso fez em termos de aprendizagem, produtividade e oportunidades de trabalho
https://t.co/zDHraba8y3
Hey, I've published an extensive introduction on how to apply a Principal Component Analysis (PCA) using the R programming language: https://t.co/qPhLBATegE
#datascienceeducation#RStats#RStudio#Statistics
Introduction to the stringr package. The package is very useful for the manipulation of character strings in the R programming language: https://t.co/G8wOXJsvzC
#programming#statisticsclass#tidyverse#RStudio#RStats
A melhor defesa da história da Libertadores, Grohe contra o Barcelona de Guayaquill em 2017, filmada pelos torcedores. O melhor são eles incrédulos no final do vídeo.
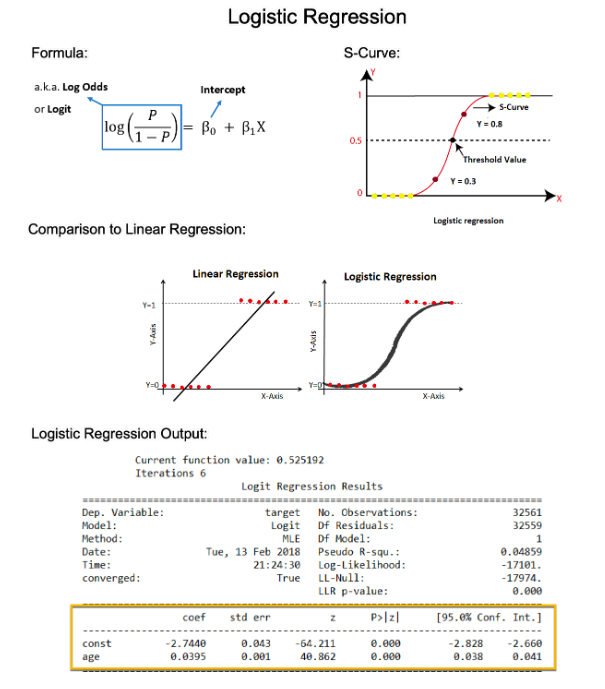
Anote aí para não esquecer nem se confundir depois: em análise de regressão o modelo é definido, SEMPRE, pelo nível de mensuração da variável dependente.
Se for binária, regressão logística
Se for ordinal, regressão ordinal
Se for categórica com muitas categorias, multinomial
Bayesian data analysis is a fundamental concept in data science. But it took me 2 years to understand its importance. In 2 minutes, I'll share my best findings over the last 2 years exploring Bayesian Modeling. Let's go.
1. Why Bayesian Data Analysis? Bayesian modeling is a powerful tool in statistics and data science, especially where traditional approaches fall short. It avoids arbitrary assumptions and provides distributions of possible values instead of just point estimates.
2. Bayes Theorem: Bayesian modeling is based on Bayes’ theorem. Bayes' Theorem provides a mathematical formula to update the probability for a hypothesis as more evidence or information becomes available. It describes how to revise existing predictions or theories in light of new evidence, a process known as Bayesian inference.
3. Simplification of Bayes’ Theorem: Since X (data) is not dependent on θ (the model) and can be hard to calculate, Bayes’ theorem is often simplified to P(θ|X) ∝ P(X|θ) × P(θ), meaning the posterior distribution is proportional to the likelihood times the prior.
4. From Bayesian Theorem to Bayesian Modeling: Bayes’ Theorem provides a process for constructing a Bayesian model. Combining key ingredients: Likelihood and Prior distributions to produce Posterior Distributions.
5. Calculating the Posterior Distribution: There are two main methods: direct calculation using complex equations, and simulation methods which create samples from the posterior distribution for summarizing information about parameters. Many software programs like PyMC, Brms, and Stan use sampling methods such as Markov Chain Monte Carlo (MCMC).
6. Advantages of Bayesian: The Bayesian approach allows for direct inclusion of prior knowledge, transparency in modeling steps, and provides broad information about the problem, including risks, uncertainty, and variability.
7. Business Cases: Any time knowledge of uncertainty is a business requirement, Bayesian modeling can benefit the business. This includes Demand Forecasting, Pricing Strategy Optimization, Customer Analysis, Credit Scoring and Financial Modeling. Businesses need to know not only a point estimate but the risk or confidence of the prediction.
===
Interested in applying Bayesian, Data Science and Machine Learning to Business. I’d like to help.
I put together a free on-demand workshop that covers the 10 skills that helped me make the transition to Data Scientist: https://t.co/LR39RJ5XKB
And if you'd like to speed it up, I have a live workshop where I'll share how to use ChatGPT for Data Science: https://t.co/EaMpKrJiqX
If you like this post, please reshare ♻️ it so others can get value.
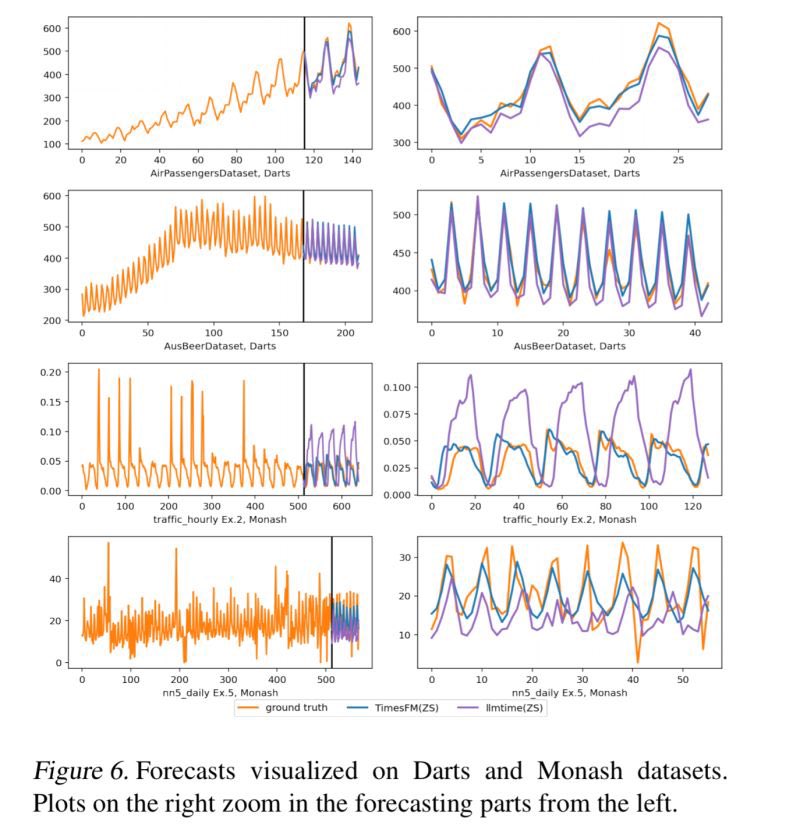
A new paper from Google that peddles “foundational model” for time series forecasting is both an example of beginner mistakes coupled with deployment of deceptive “benchmarks.”
In figure 6 the authors try to portray performance of the new “wunderwaffe“ in positive light. The only problem - well in fact there are several.
1. One should never evaluate performance visually. This is a beginner 1.01 mistake and has been explicitly mentioned in Forecast Evaluation for Data Scientists: Common Pitfalls and Best Practices” by Christoph Bergmeir and Hansika Hewamalage. As the authors of this great tutorial explain “The visual appeal of a generated forecast or the possibility of such a forecast to happen in general are not good criteria to judge forecasts.” The tutorial explains in more details why.
2. Google authors deployed a standard trick to embellish performance of their new “foundational model.” They used classical datasets such as air passengers that can be very easily fit using classical models (almost to perfection).
Did they use classical models as benchmark? Of course not - what they did instead is they used another bad model llmtime.
#timeseries
#forecasting