Our paper “Difference-in-Differences Designs: A Practitioner’s Guide” is now published in the Journal of Economic Literature. It took us a while but we are happy!
We put together a lot of material to make the paper useful in practice: https://t.co/30TbAgihlz
Hope you like!
I've written a @claudeai skill that is useful when you’re starting a new project and want to absorb fifty papers before writing a word yourself.
/tyler converts a folder of academic PDFs into a token-efficient markdown wiki for literature review. Point it at a directory of papers and it produces one lightweight .md file per paper, plus an index, so Claude Code can load an entire literature into context without burning tokens on raw PDF parsing.
Named in honour of @tylercowen, the economist behind @MargRev and a famously voracious reader.
Available from --> https://t.co/B6mVrbmB4U
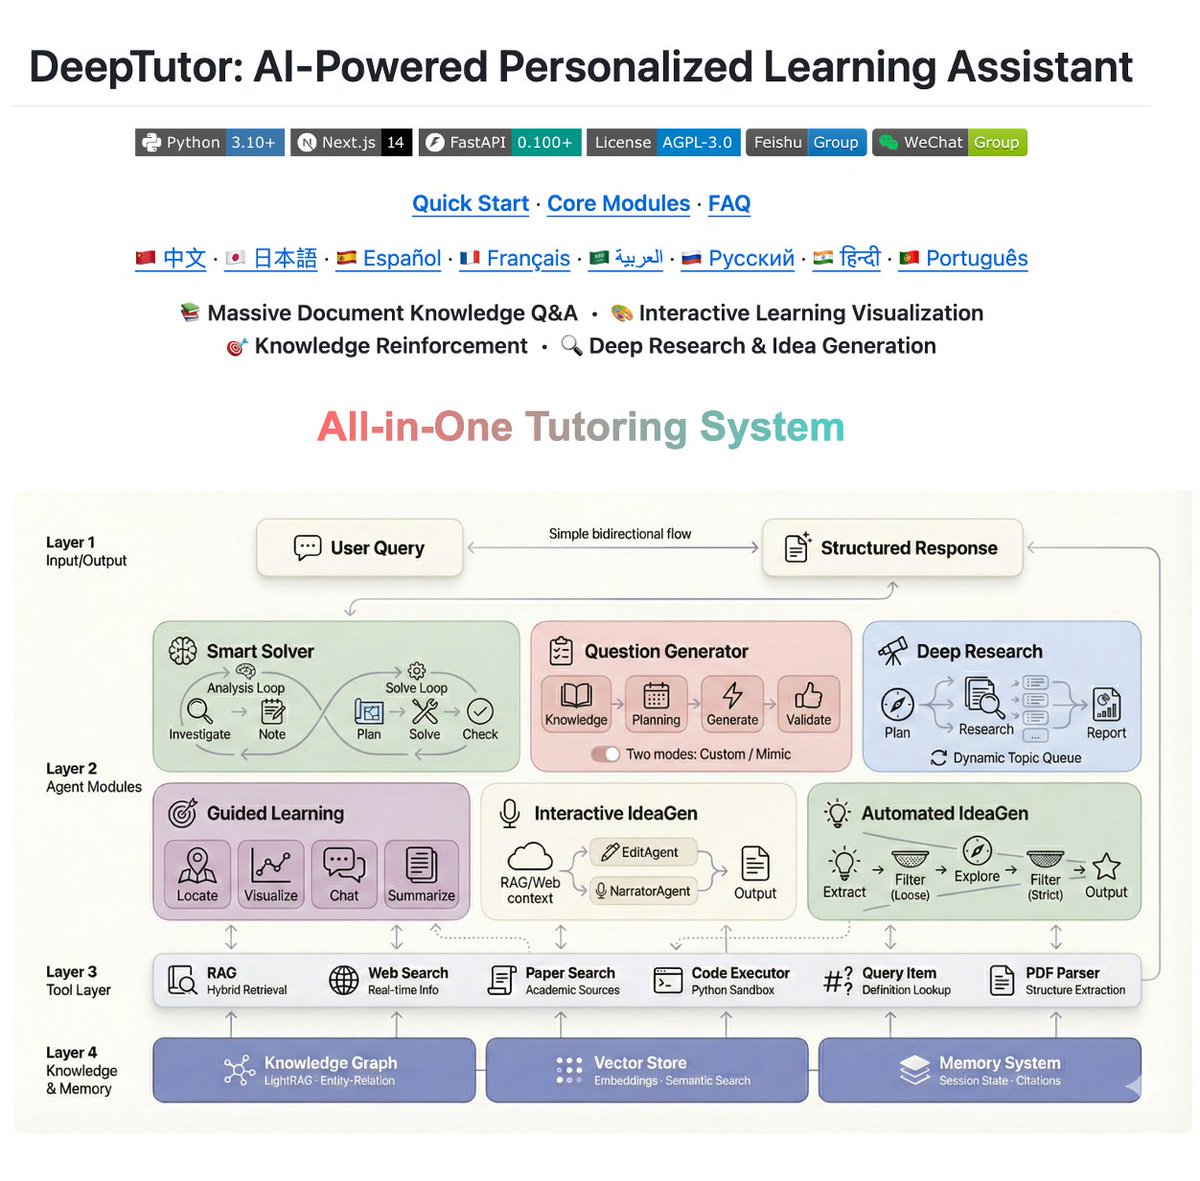
Released just five days ago, DeepTutor has already surged past 1.4K stars on Github! It seems people are hungry for a smart learning assistant that truly understands them.
🔗 Fully Open-Source: https://t.co/Wd8odKIRSn
We talked to countless students and kept hearing the same pain points: existing AI tools are either too fragmented or fail to capture personal learning context effectively. That's exactly why we built DeepTutor—to create an AI learning companion that actually remembers your progress and adapts to your unique learning style.
DeepTutor's Core Architecture
- 💬 User Interface Layer
Intuitive bidirectional interaction with structured, actionable outputs that organize complex context seamlessly.
- 🤖 Intelligent Agent Modules
Specialized multi-agent collaboration: problem solving, deep research, guided learning, and idea generation.
- 🔧 Tool Integration Layer
Unified access to RAG retrieval, real-time web search, academic databases, and code execution capabilities.
- 🧠 Personalized Knowledge & Memory Foundation
Persistent memory system built on knowledge graphs with contextual session tracking. Creates truly personalized learning experiences tailored to your individual progress and preferences.
Mahalanobis distance measures how far a point lies from a distribution by accounting for correlations and scale among variables. Unlike Euclidean distance, it uses the inverse covariance matrix, making distances dimensionless and sensitive to the data’s geometry. In probability, it naturally arises in multivariate Gaussian theory, hypothesis testing, and confidence regions. In machine learning, it is central to anomaly detection, clustering, metric learning, discriminant analysis, and outlier removal, where respecting feature correlations is crucial. In real life, Mahalanobis distance is used in fraud detection, quality control, face recognition, medical diagnostics, and fault monitoring, allowing systems to identify unusual patterns relative to normal multivariate behavior rather than relying on naive geometric distance.
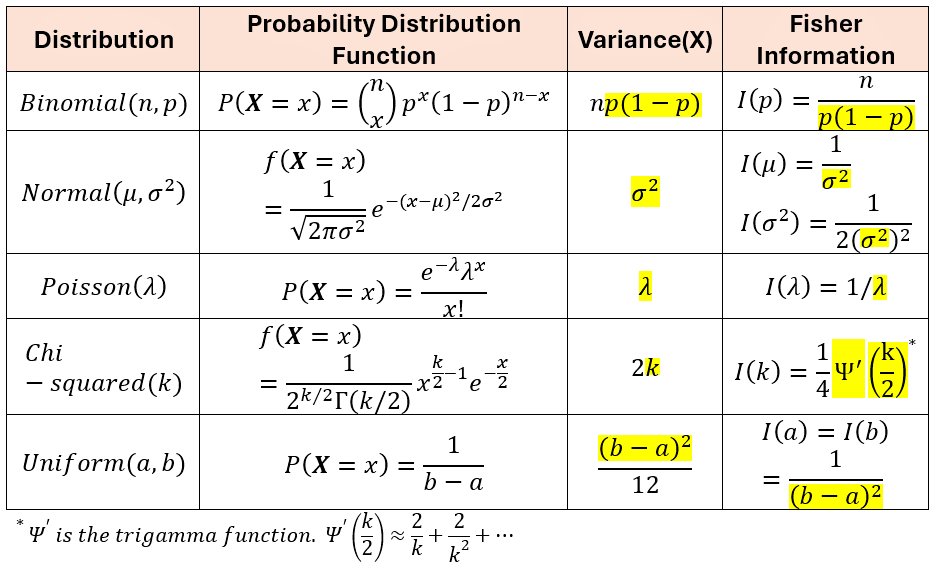
Fisher information measures how much information an observable random variable carries about an unknown parameter, quantifying how sensitive a probability model is to changes in that parameter. In probability and statistics, it underlies the Cramér–Rao lower bound, setting fundamental limits on estimation accuracy and guiding optimal experimental design. In machine learning, Fisher information appears in natural gradient methods, information geometry, variational inference, and continual learning, where it helps adapt parameters efficiently and avoid catastrophic forgetting. It also plays a role in uncertainty quantification and model comparison. In real life, Fisher information is used in signal processing, communications, medical imaging, and sensor design, helping engineers place measurements where they are most informative and enabling precise estimation under noise.
Image: https://t.co/h2aVCgSTr9
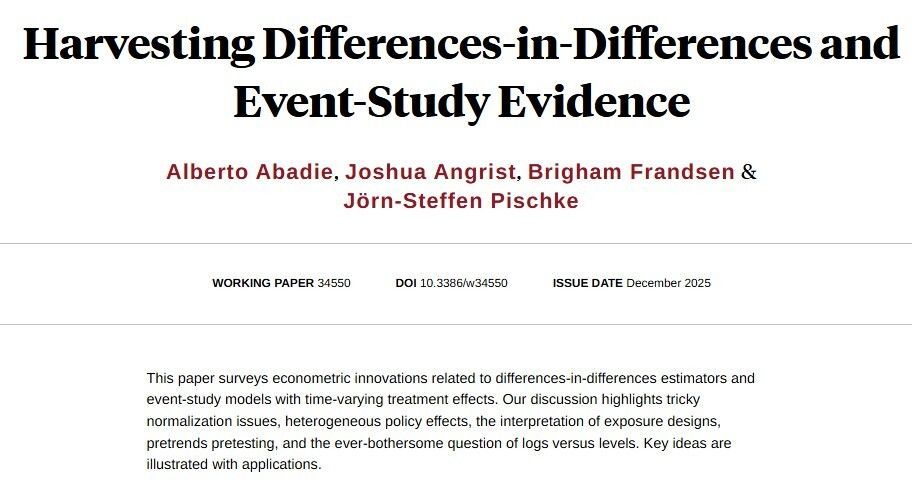
Surveying econometric innovations related to differences-in-differences estimators and event-study models with time-varying treatment effects, from Alberto Abadie, @metrics52, Brigham Frandsen, and Jörn-Steffen Pischke https://t.co/LwfrmiLv7R
The following @Stata packages have been updated on #SSC:
👉 alluvial v1.51: https://t.co/UvWDcXq857
👉 geoboundary v1.22: https://t.co/IUNQYtiWj8
👉 graphfunctions v1.6: https://t.co/IaZCKsG719
👉 treemap v1.62: https://t.co/CrkPLSHkkc
All updates bring new features, bug fixes, enhancements, so test them out! This is the last update for 2025 on SSC.
The figure below shows which packages got the most attention in 2025 in terms of new releases on GitHub (https://t.co/cBC3o6KS7j). Definitely there are fewer releases in 2025 as compared to previous years. The older packages that are regularly used are currently in a solid place so changes are mostly marginal. Might go back to some of the abandoned ones and revive them.
2026 will focus more on the consolidation of some of these packages to make them more streamlined.
(MGLMMs) are an advanced class of statistical models designed to analyze multiple correlated response variables that follow non-Gaussian distributions and arise from hierarchical or clustered data structures. https://t.co/WtrHkiDeAO
#DataScience#RStats#DataScientist#coding
Generalized Linear Models (GLMs) are a powerful extension of linear regression in statistics. They allow for response variables that aren't normally distributed (e.g., binary or count data) by using a "link function." In machine learning, the most famous GLM is logistic regression, which is a workhorse for binary classification. In real life, this powers everything from credit scoring and medical diagnosis to predicting the number of customer arrivals with Poisson regression.