The Moonwave Forecast Archive: Every 4-week forecast, timestamped. Every Grok evaluation, timestamped. Every hit and miss included, plus raw JSON if you want to check for yourself.
https://t.co/lCLdtEEhJr
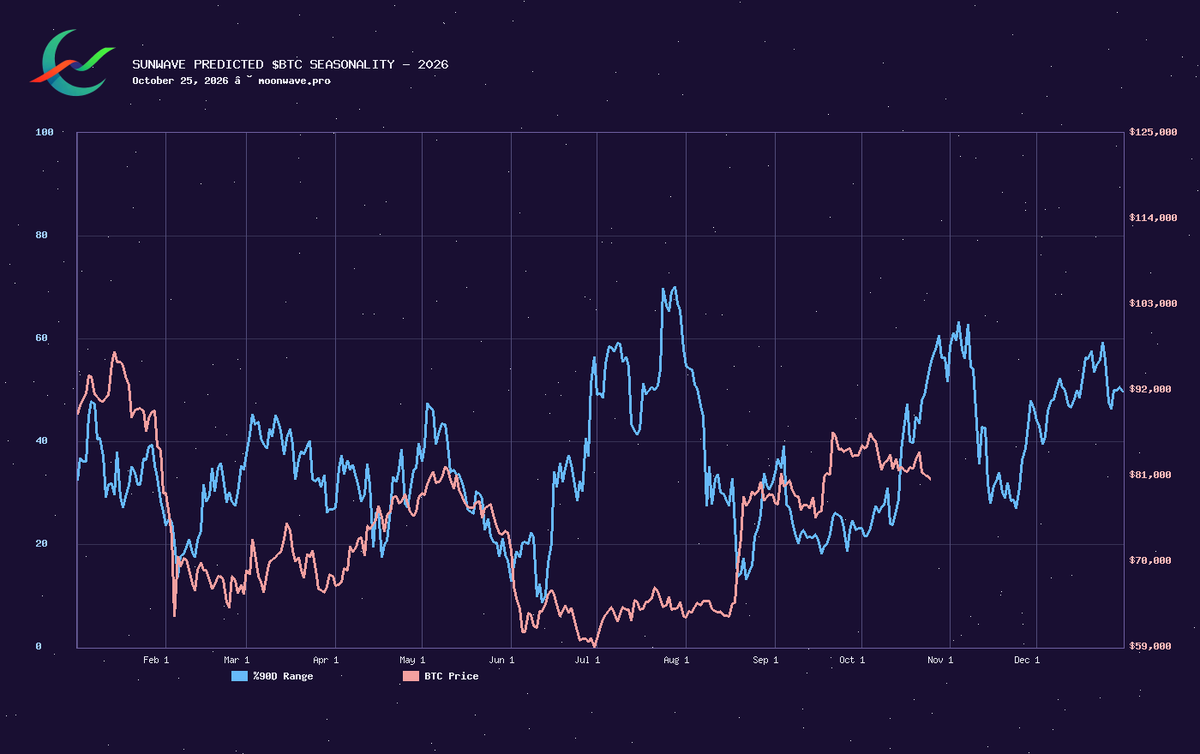
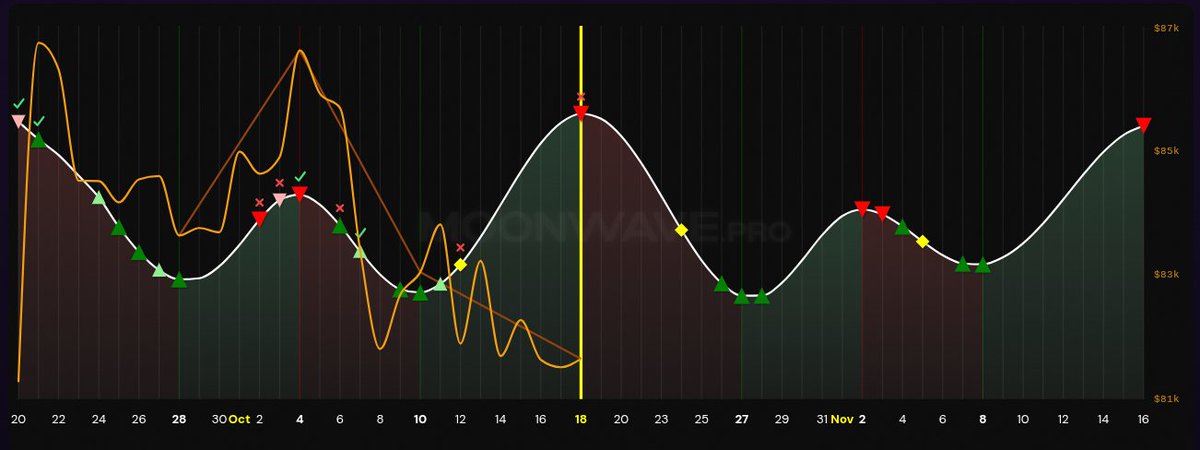
Weekly Update – October 25, 2026 (1/2)
Buy cluster Oct 25–28 looks good, with wave strength strongest on the night of the 27th into the morning of the 28th (FOMC). Assuming no terrible surprise from Warsh, that should set up a good rise into the next high-risk zone Nov 2–3.
Ahead:
• Buy cluster Oct 25–28 (strongest 27th-28th)
• High-risk zone: Sells Nov 2–3
Recap: Wave called directional accuracy well on both Bitcoin and NASDAQ. The flagged Oct 18–22 high-risk zone paid off for bears, and the Oct 24 (weekend) Volatility manifested for crypto markets. Since current Volatility rules need live FX data (which doesn’t exist on weekends), the demo BTC strategy auto-invalidated the call - next development priority is handling market-closed Volatility signals with available data.
(2/2)
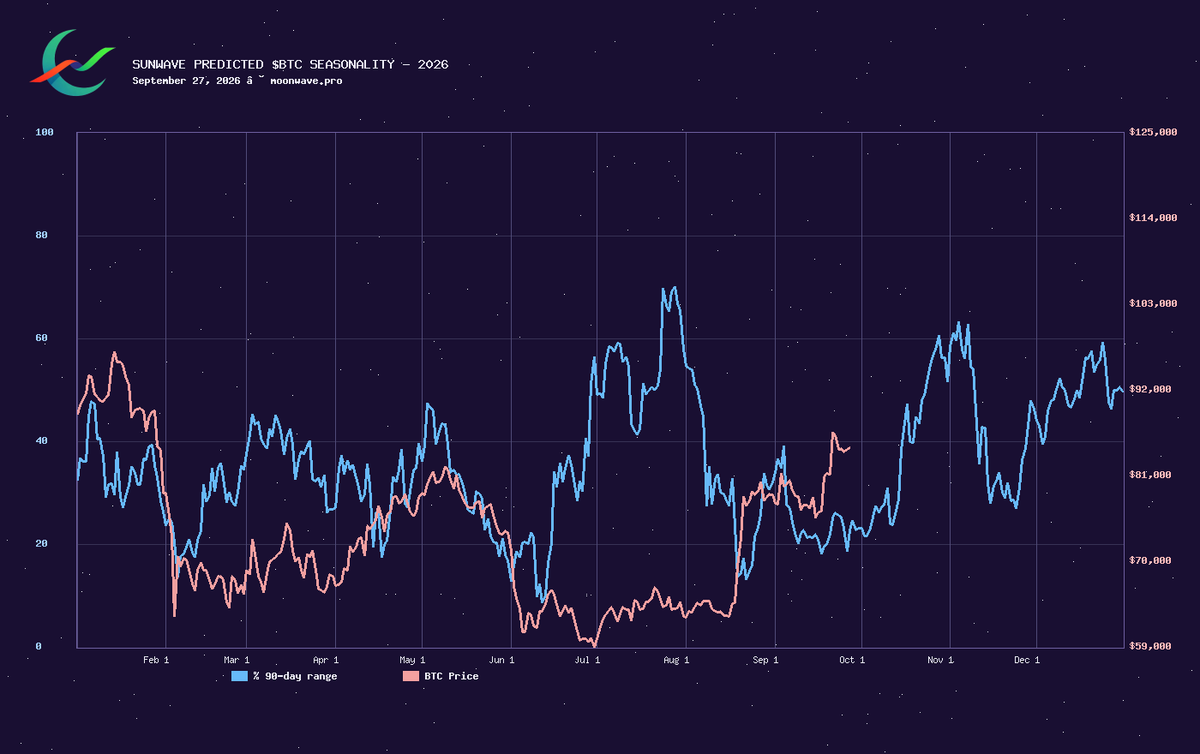
Sunwave: BTC diverged from the experimental seasonal model's predicted uptrend, a little concerning. This week should be instructive.
QQQ: The strategy is continuing to hold long.
Updates: New transparency and live-update features roll out this week. We'll update here when they go live!
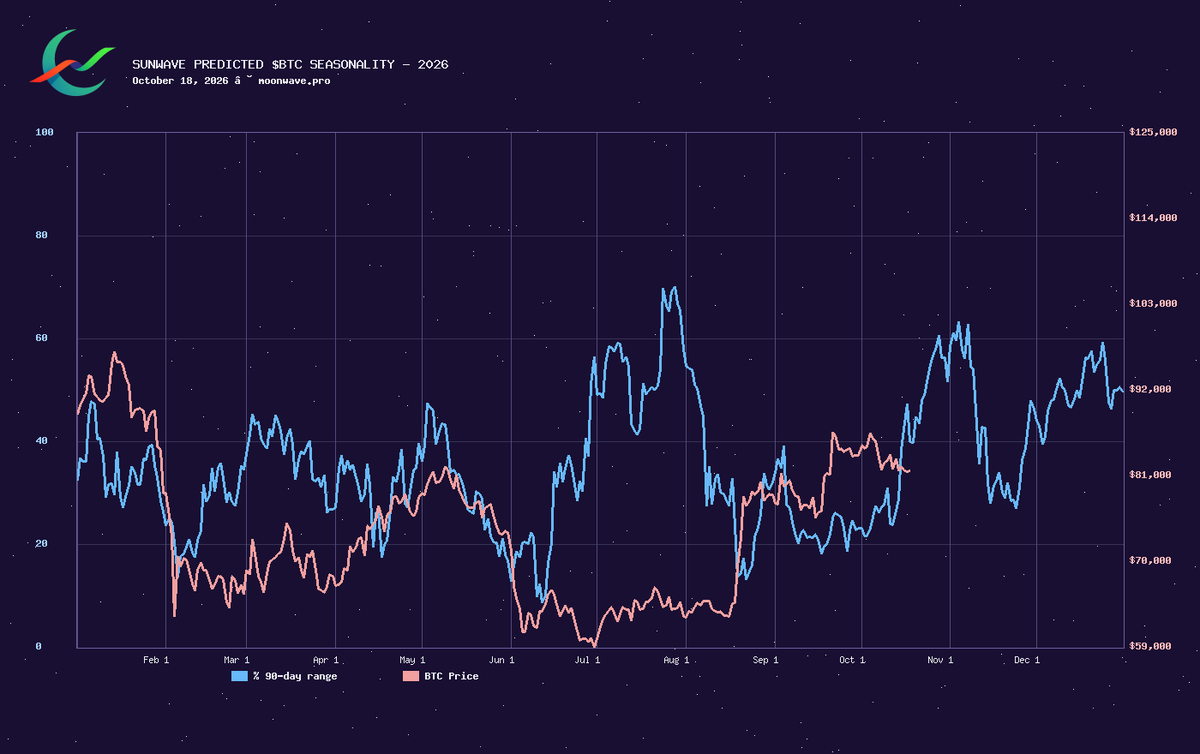
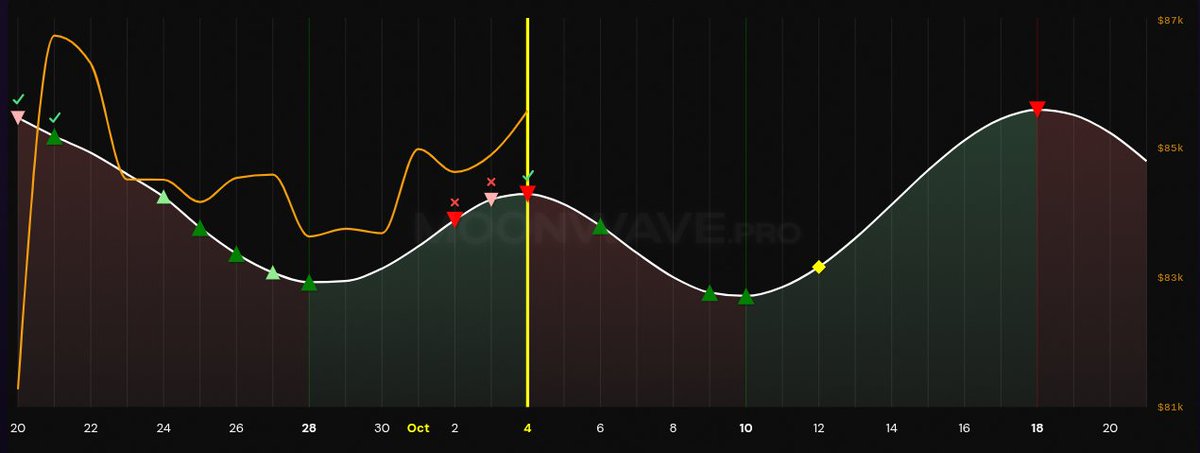
Monthly Moonwave - Oct 18, 2026 (1/2)
Good, not perfect, month for the system. The wave predicted the overall direction of BTC, and even most entry/exits very well, and volatility signals delivered, but FX-based Buy timing shifts underperformed, buying early on dips. Even so, as of writing the strategy is up for the period.
Despite the Oct 18–22 period being marked as “high risk” by the physics engine, both BTC strategies and the QQQ strategy invalidated today’s Sell (Oct 18). Bulls will want to see strength through the 22nd.
Ahead: Up first is a Volatility signal Oct 24 and the first solid Buy signals Oct 26–28, the last of which lands on a critical FOMC date after last week’s hot CPI/PPI prints. Another “high risk” zone starts with the Nov 2–3 Sell signals, though they’re followed by Nov 4 Buy and Nov 5 Volatility into the later Nov 7–8 Buy range, then up to a (provisional) Sell Nov 16. It’s hard not to read that Nov 2-8 range as a volatile week into the midterms.
(2/2)
Sunwave: The experimental seasonal-momentum model continues to perform well, catching the Monday dip and now forecasting “up” into the Nov 2–3 high risk zone and then. A QQQ Sunwave is coming this week!
QQQ: The NASDAQ strategy is live and executed its first decision, invalidating the Oct 18 Sell and holding its (from the backtest) Aug 26 long.
Updates: Still gathering results on Strategy 2.0, some UX polish and updates to the FAQ section of the site, and the ability to track QQQ performance on the Moonwave chart. Lots more coming!
Note: An earlier version of this post was deleted after spotting some typos.
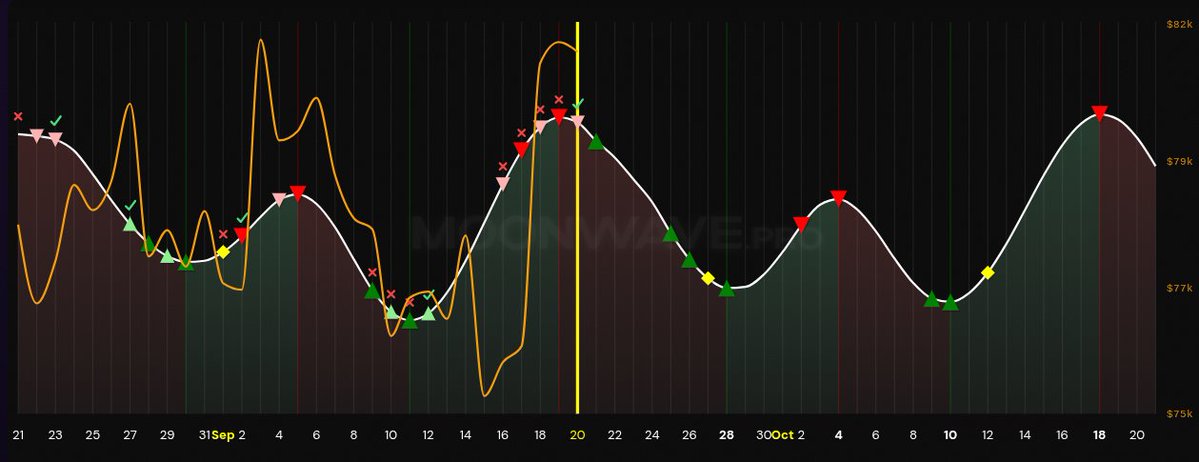
The Moonwave $QQQ strategy is live, and documented on its own Forecast Archive:
https://t.co/CnfjxGii9R
The same liquidity-wave method used for BTC appears to work on QQQ, with some differences: Higher order-book density means modeling the demand-liquidity “fluid” with much higher "viscosity" - waves propagate more slowly and smaller ones dissipate quickly, and there was the additional challenge of modeling wave travel across market-closed periods (nights, weekends, holidays). As a result, the QQQ strategy is very conservative and slower than the rapid BTC version, concentrating on large, high-probability moves and longer holds. Ironically, it's easier to model a highly volatile, 24/7 asset like BTC than a larger, slower-moving index that takes regular breaks.
At writing, it is (of course) 100% backtest. The public era will begin with the first live trade, which we’ll announce here, add to the transparency page, and include in the machine-readable record at https://t.co/otYcNHYudf.
This is an experiment and very much not financial advice, the strategy will almost certainly be refined as real results arrive, and past performance is not a guarantee of future results, but we’re optimistic about the backtested performance so far!
(2/2)
Sunwave: The experimental seasonal-momentum indicator continues to perform well in fall, and implies an uptrend into November. A possible dip Monday aligns with the Volatility signal - if it arrives (barring terrible news), that dip is for buying.
Updates: QQQ/SPY strategy finalized. Its own forecast record page with (right now 100%) backtest goes live this week and will update as the system makes trades. Strategy 2.0 is nearly finished and running in parallel on BTC - so far the timing refinement looks promising (sample of 4 trades).
Weekly Update – October 11, 2026
(1/2)
Rising wave into Oct 18 looks very good for the bulls. Monday (Oct 12) Volatility is a possible last-chance entry if it confirms.
Recap: The recent story continues: direction right, timing early. The BTC demo confirmed an FX-delayed Buy on Oct 7, but price continued dipping into Thursday before rising into the physics Oct 9–10 Buy zone.
Ahead: Volatility signal for Monday looks unlikely to confirm but might still give sidelined bulls a final entry. Then the rising wave into Oct 18 is the main setup.
Weekly Update - October 4, 2026
(1/2)
Recap: The Sep 21 Buy worked. The Sep 28 Buy produced a dip into the 83k range, and price sat in the mid-$83s through the Sep 30 PCE print. Friday’s jobs report missed hard: +29k versus about 90k expected, unemployment at 4.2%, hourly earnings +0.1%. Bitcoin spiked on the news, then settled in the 85k range over the weekend.
Ahead: The demo confirmed the short today, Oct 4, and is now underwater. There is a faint Buy for Oct 6 that sat just below the inclusion threshold for the chart in September, but we’re including it now. It's worth watching, especially if the current negative FX trend reverses. The first clear Buy is Oct 9, followed by another on Oct 10.
Monthly Moonwave - July 26, 2026 (1/2)
Key dates ahead:
Buy: Jul 29 (strengthens Aug 1)
Volatility: Aug 5
Sell: Aug 7
Buy: Aug 11-13
Sell: Aug 20-21
After a tough June, July was a return to form. The Jun 29–Jul 1 Buy was a strong entry, the Jul 6-7 Sell delivered the expected pullback, the Jul 8 Volatility marked an early reversal, price dipped into the Jul 13-15 Buy zone, and the confirmed Sell on Jul 23 closed the move cleanly.
Strategy + FXwave as confirmation continues to work very well.
@grok Thanks Grok! To continue, our hypothetical Moonwave BTC trader then:
Short Sep 2
Buy Sep 12
Short Sep 20
Buy Sep 21 (open).
How did they perform?
(2/2)
Sunwave: The experimental seasonal-momentum model implies consolidation or slower momentum, then an upward acceleration into November. If the Oct 2-4 sells confirm, the two indicators will be in conflict. That is the interesting test this coming stretch.
Updates: Work is still concentrated on Strategy 2.0. QQQ and SPY are in backtest and looking strong so far. Index books are deeper and slower than crypto, and the closed-market windows change the math - demand waves move slower per trading hour, but nights, weekends, and holidays interrupt and compress the full-liquidity calendar. Still, early results are very encouraging.
Is there a ticker you'd like to see tracked? A question about the system? Drop it in the replies - we read every one.
Weekly Update - September 27, 2026
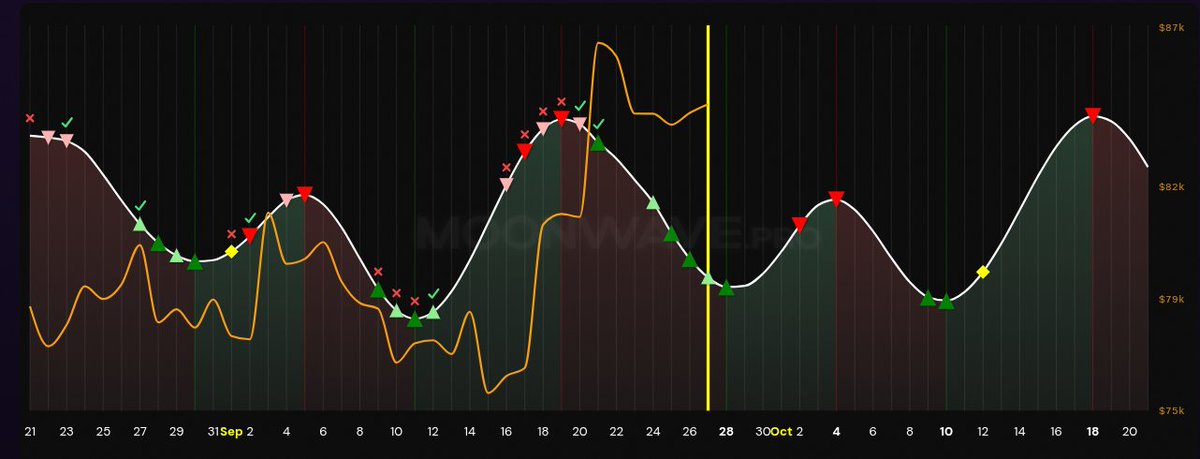
Physics saved the day! Strategy exited the losing 20th hybrid-FX Sell and went long on Sep 21. From last Sunday’s ~$81,200, BTC ran to ~$87,300 on the Buy date, then gave some of it back into the low 83s through the Sep 25-26 Buys.
Now the question is whether tonight’s Volatility into the mild Sep 28 Buy is the last chance for sidelined bulls, or whether Friday already took that slot.
Next data to watch: JOLTS / consumer confidence on Sep 29, then the Q2 GDP revision and August PCE on Sep 30. Those are the most likely places for an early turn ahead of the first Sell on Oct 2, which lands on US unemployment and wages. That is the first serious short window before the stronger Oct 4 wave top.
The FX side was really constructed with "normal" currency-pair movements in mind in order to establish momentum as a proxy for market liquidity - when G7 currency pairs start making moves like tech stocks, it really ruins the balance! Lessons learned, though - maybe we'll deweight FX if there are future interventions.
Monthly Moonwave – September–October 2026
Solid month, not a perfect one. BOJ–Fed yen support kept distorting the FX component of the model. Through early September the demo was consistently about three days early on buys and three days late on shorts - all hybrid FX-physics points, all underperformed the pure-physics dates. Still profitable on the month, especially the mid-September long, even if the entry was early.
As of writing the strategy is short again on (again) a hybrid-FX signal, but looks likely to confirm the Sep 21 buy and flip back long. More buy windows follow on Sep 25-26, then Volatility on Sep 27 into a final buy on Sep 28. Momentum is really strong, though, so this looks more like a last-chance entry than a local bottom.
First area of concern after that is the Oct 2 sell, which lands on the jobs print. A hot number that lifts hike odds could bring the weakness in early, ahead of the stronger Oct 4 sell.
(1/2)