SILVER —
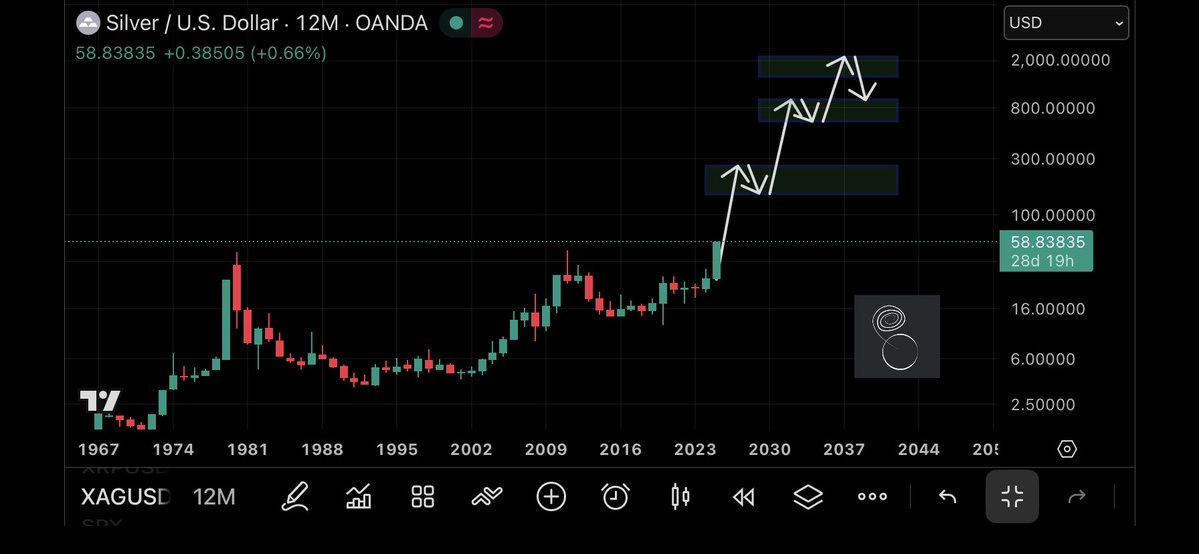
At only $58 per ounce — and the Gold-Silver Ratio at 71 — silver has begun the first phase of a global revaluation that will take more decade to fully unfold.
👉👉 https://t.co/17HVrKsr2u
By 2028, silver will be $258 per ounce, and the GSR will have fallen to at least ~37. This is a natural price correction after decades of being undervalued.
👉👉 https://t.co/bXvY6FNUJc
In 2030, silver will begin to climb again in a second phase of revaluation.
By 2032, this time driven by a period of heightened global instability, silver will reach $937 -$616 per ounce. The GSR will likely rebound to ~75 in this process with gold as a safe haven and global reserve asset.
👉👉 https://t.co/T8xqzRtE4v
By 2035, the third phase will be underway.
In 2036, the world will be adjusting to a fundamentally new geopolitical and economic paradigm centered outside the West. Silver will rise to between $2163 - $1481 per ounce as it is acknowledged globally as a store of value and a reserve asset alongside gold.
👉👉 https://t.co/CJ3Nd6U2yl
The path is clear. Phase one is happening before our eyes. I will reference this post as the years progress and leave the chart below as-is to observe its development.
The journey has officially begun 🫡
#Silver#XAGUSD
Order Block / FVG (Fair Value Gap): 63.40 – 64.50. This is the first key reaction zone below the current price, serving to determine whether buyers are still defending the overall bullish structure.
Demand Zone: 61.20 – 62.70. This is a deeper support area. Should the price drop below the first reaction zone, this area becomes the next key level to watch for a potential bullish reaction.
Silver Update. As discussed earlier Silver was supposed to go to $70 from $55. I told you in July that we will trade in 70 in a month.
We will retest 64 and will again 70 coming week.
Check out my #SILVER analysis on @TradingView: https://t.co/I3pcDCFZxz
Silver 🥈— $68.65 — holding above the $66.86 correction-25% level so far.
Daily RSI at 64 with a bit of rounding... if the daily needs to cool off and it goes below $66.86 I'll be watching $64.10 for a bigger pick up, maybe $61.02 if they want to paint it ugly —
— but let's be real, I'm stoked to snag a few ounces of physical here and there while it's under $70 either way it goes🫡
#XAUUSD#GOLD
Next week's trading will focus on the two key support levels of $4530 and $4450.
The primary resistance level is $4630-$4650.
If $4530 holds, the strong uptrend will continue, with a potential rebound to around $4720.
If $4530 is decisively broken, the market will enter a period of high-level consolidation.
$4450 remains a good entry point for long positions, with a target of $4630-$4650. Hold positions if the price breaks through this level.
#XAUUSD#GOLD
The chart shows gold pushed sharply from the lower base and is now reacting near 4,600.
This area is close to the End wave 5 zone around 4,640–4,670, so short-term hesitation or rejection is normal.
If gold cannot break higher directly, price may start an ABC correction. The first support to watch is the Buy zone around 4,380–4,410. A deeper correction may bring price towards the End wave C / Buy zone around 4,200–4,230.
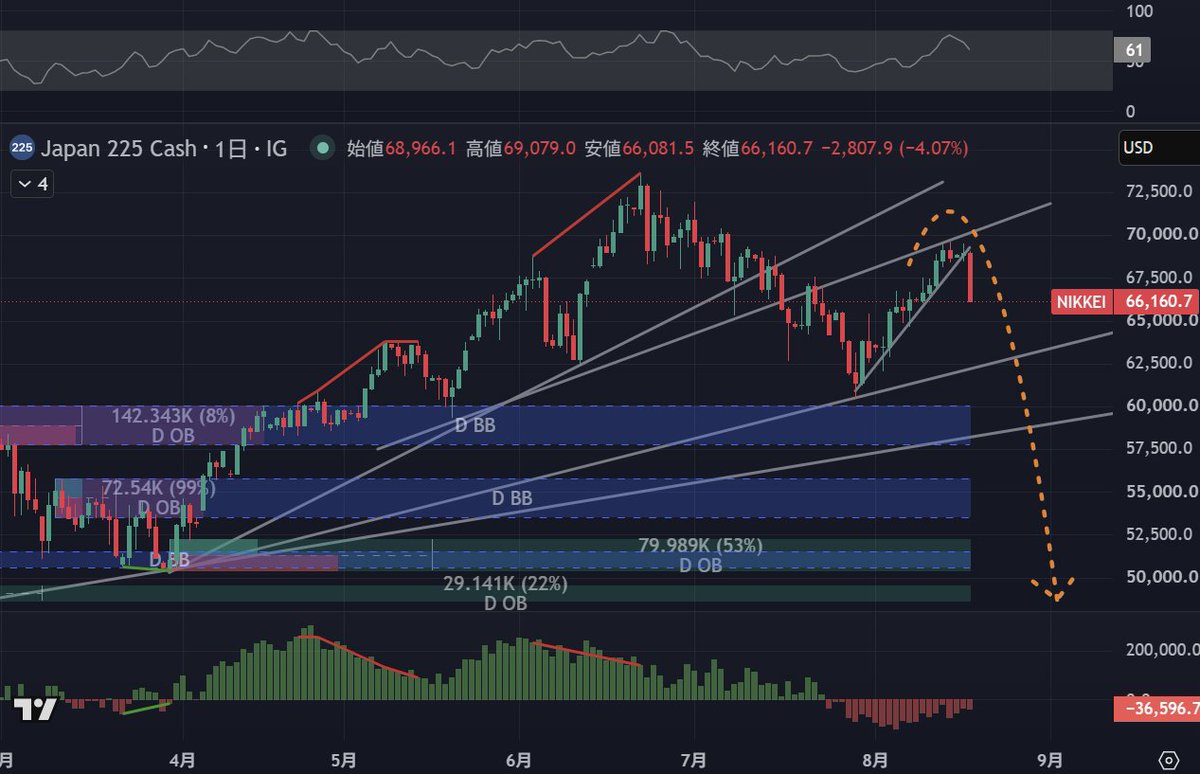
That neckline is key. If the Semiconductor Index can break decisively back above it, that would negate the short-term bearish scenario.
But if it rejects that neckline and rolls over, look out below.
https://t.co/eBLZUHsKK9
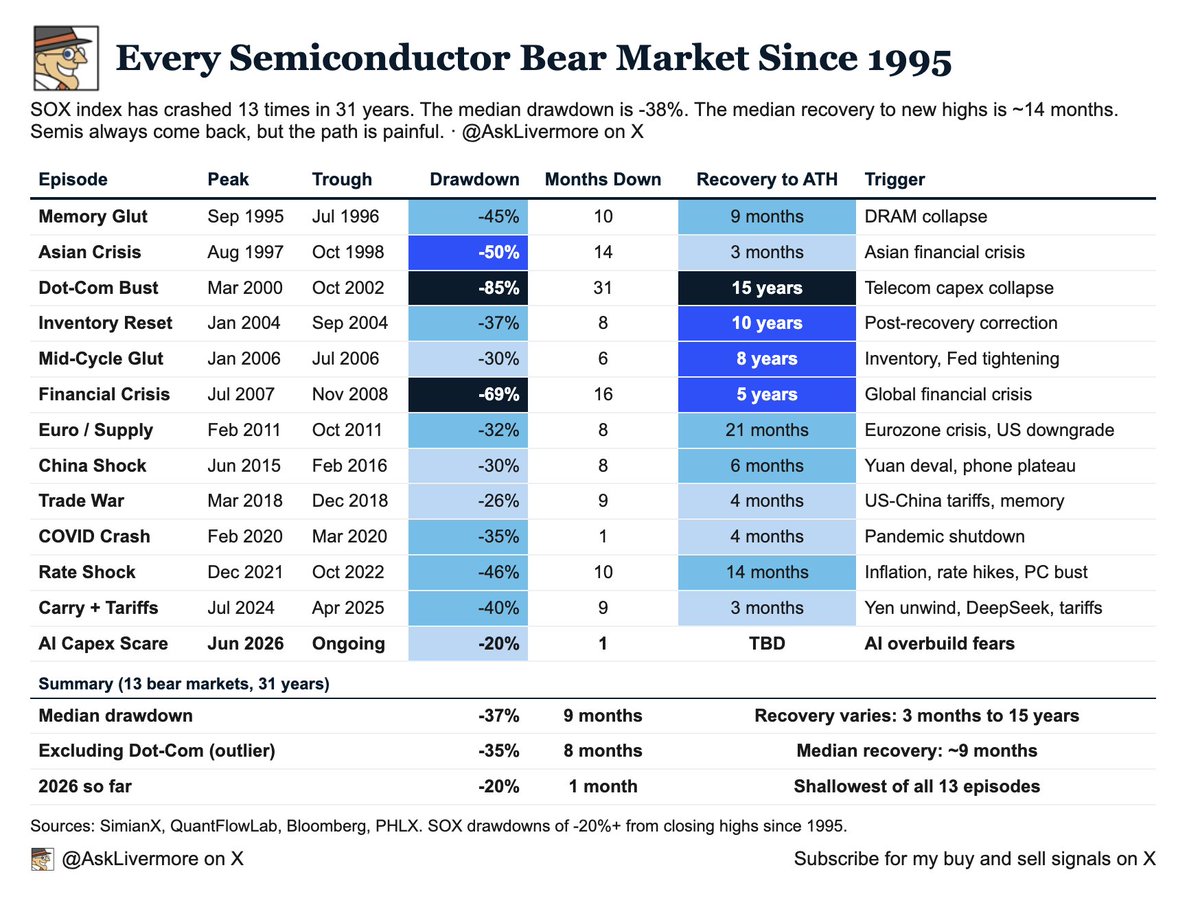
Semiconductors entered their 13th bear market in 31 years last month.
That is once every 2.4 years. This is not unusual. This is what semis do.
Here is every $SOX crash since 1995 and how long it took to recover:
• Asian Crisis: -50%, recovered in 3 months
• Trade War 2018: -26%, recovered in 4 months
• COVID 2020: -35%, recovered in 4 months
• China Shock 2015: -30%, recovered in 6 months
• Memory Glut 1995: -45%, recovered in 9 months
• Rate Shock 2022: -46%, recovered in 14 months
• Carry + Tariffs 2024: -40%, recovered in 3 months
• 2026 so far: -20%. The shallowest of all 13 episodes.
The median semi bear market drops 37% and lasts 9 months. We are at -20% and 1 month in. The most recent crashes(2018, 2020, 2024) all recovered in 3-4 months.
The only one that did not recover quickly was the Dot-Com bust. That took 15 years. But that was an -85% collapse with zero earnings behind it.
Today semis have record revenue, record margins, and every company on earth is buying chips for AI.
Semis crash. Then they come back. Every single time, in a few months.
Going back to 1986, here's what August through December looks like in every midterm year:
• August: choppy, either a really bad month or a really good month. +4.2% median gain, but -1.0% average gain.
• September: bad month.
• October: +4.8% median, 80% win rate. This is the midterm rally.
• November: +4.5% median, 70% win rate. The rally continues.
• December: worst month typically with only a 40% win rate. Tax loss selling hits hard.
The total Aug to Dec return is +7.9% median with a 60% win rate, which is a good sign.
If this follows the historical playbook, expect chop through September, a strong October and November, then give some back in December.
Analogs speak loud
There is a strong history among commodities that parabolic advances, once violated, produce 80% declines. That would be Gold to $1,120.
Don't think that will happen, but a 50% decline brings price back to $2,800 or so