Peter Lynch turned $18M into $14B.
His 6 rules for 10x stocks:
1. Trailing P/E < 25
2. Forward P/E < 15
3. Debt/Equity < 35%
4. EPS Growth > 15%
5. PEG Ratio < 2
6. Market Cap > $5B
"The person that turns over the most rocks wins the game."
The edge isn't prediction. It's discipline.
Nobody explains hedging with real numbers. Let me fix that.
You have $100k. 90% is in stocks ($90k). The other $10k is where most people get it wrong.
Two ways to hold that $10k:
→ Unhedged: $90k stocks + $10k cash
→ Hedged: $90k stocks + $7k cash + $3k in SPY puts
That $3k? It's insurance on your $90k. That's the whole trade.
Lets get to the numbers:
- Market drops & your portfolio falls by 8%:
Stocks fall to $82,800. → Unhedged: $82,800 + $10k = $92,800 (-7.2%)
→ Hedged: $82,800 + $7k + puts payoff ($7.5k) = $97,300 (-2.7%)
$4,500 difference. Same portfolio. One decision.
- Market rises & few holdings do well but others dont so overall your portfolio is up 5%:
Portfolio climbs to $94,500.
→ Unhedged: 94,500 + 10k ( cash ) = $104,500 (+4.5%)
→ Hedged: $94,500 + $7k ( cash ) + $1500 ( hedges lose 50% = $103,000 (+3.0%)
You gave up 1.5%.
That's the cost of sleeping at night.
Hedging isn't a cheat code.
You won't win in a bull run.
But it's not for bull runs. It's for:
→ When volatility picks up
→ When the market is showing clear weakness
→ When indices are rangebound, use hedges to hold the stocks you like without sweating every dip. The puts offset your losses
You're not trying to predict the crash. You're just making sure one bad month doesn't undo a good year.
For 80% of people- The Best strategy is just raise enough cash.
That's the whole point.
Save this for everyone can revist this at a later date.
Open Interest 🧵
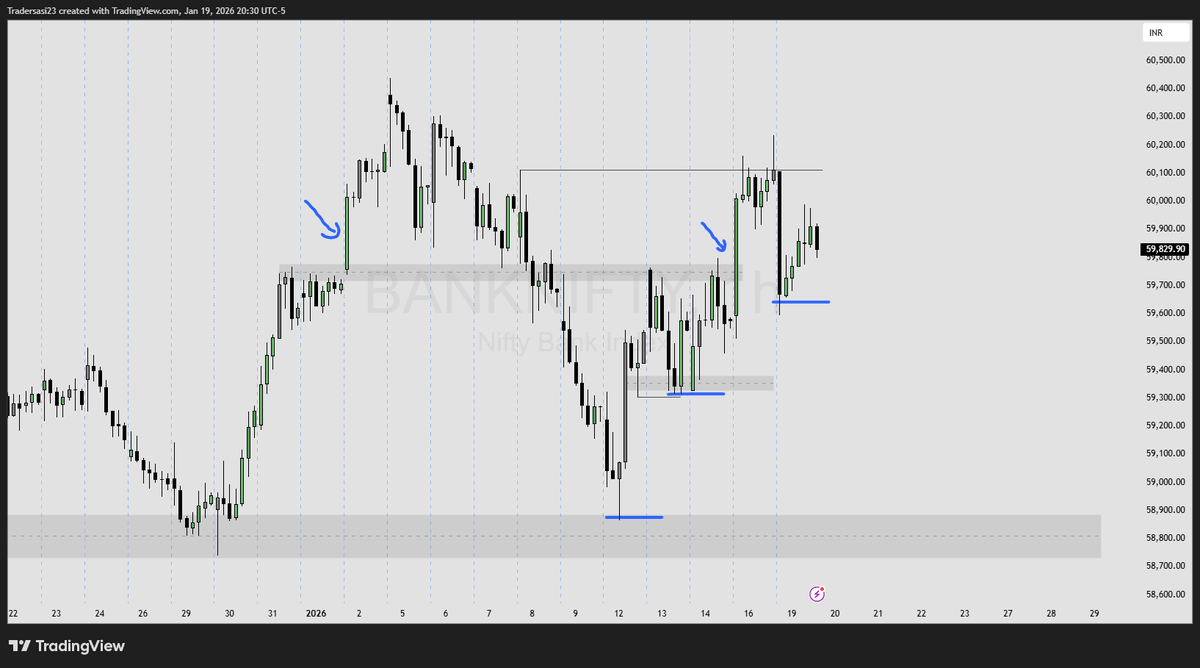
Most traders only look at Price Action. But if you want to know where the "Big Players" are trapped, you need to look at Options Open Interest (OI).
Here’s a simple breakdown of how to use OI. 👇(1/13)
On days like today when everything is testing back into key EMA's, I like to look for reversals within the long term trend
But
I'm never trying to catch the bottom blindly...
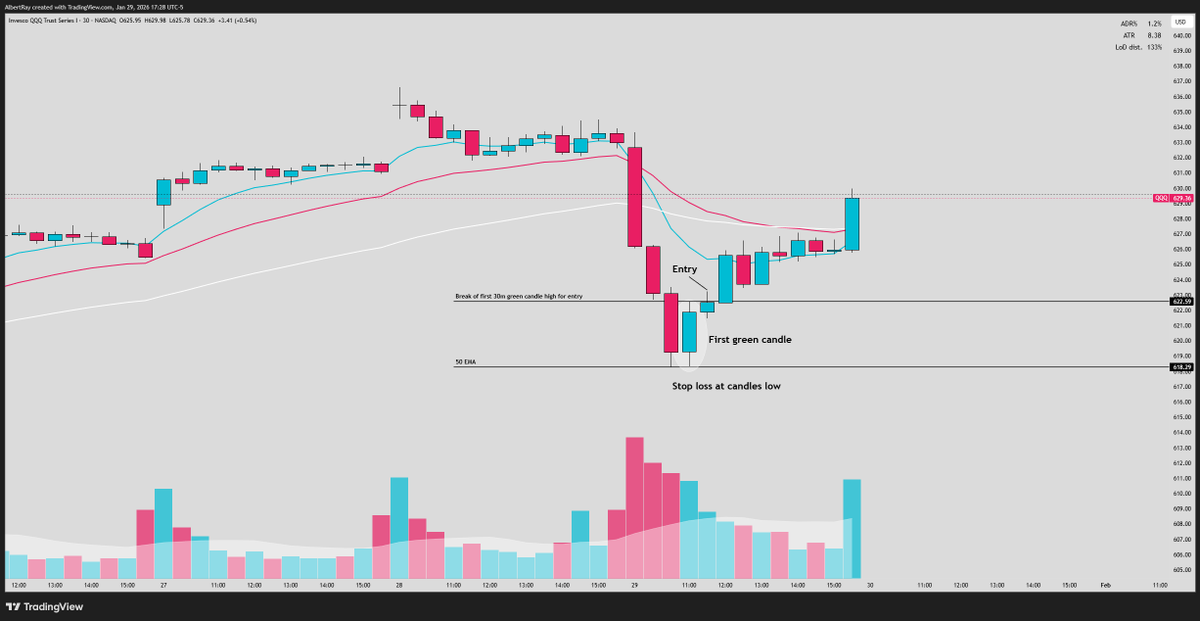
So I've been implementing the 30 minute pivot into my trading for reversals off of key spots
This is a concept I first learned from @1ChartMaster it gives you a high probability for a reversal to occur with a super tight risk
I generally look for the 30m pivot off of a key moving average or level where I know buyers are likely to step in
Essentially the 30m pivot is:
1. Looking for the first 30m candle that forms after a downtrend
2. Mark out the highs of the first green 30m candle
3. Entry for a reversal on the break of the 30m green candle high
Once you take an entry your stop can now be low of the 30m candle
Today $QQQ tested down to the 50 EMA, where it has bounced multiple times in the past...
The first 30m candle was printed, and shortly after the 30m pivot triggered on a break above the high of the candle
This was a nice way to catch a bunch of reversals today coming off of the big sell off in the morning.
Pivot levels act as key support and resistance zones, while EMA (Exponential Moving Average) helps track the trend direction.
Together, they help spot high-probability entries and exits.
#pivotlevel#TradingTips#emaindicator
HOW TO ENTER AND EXIT SWING TRADES
This system generated me over $3 Million last year
ENTRY (Long):
- DAILY Chart
- 8 EMA crosses above 200
- Break of Structure
- Buy the first pullback that holds
Stay in: As long as price holds 8 EMA and Structure (Trend)
EXIT / STOP:
- Stop under recent swing low
- Exit when structure breaks
- Exit when 8 EMA breaks
Why: Lets you trade the trend, filters noise, avoids chop