MrChart | Institutional-grade US market intelligence
Stocks • Options • Smart Money • AI
Clear scores. Real value. Zero noise.
Follow for daily clarity.
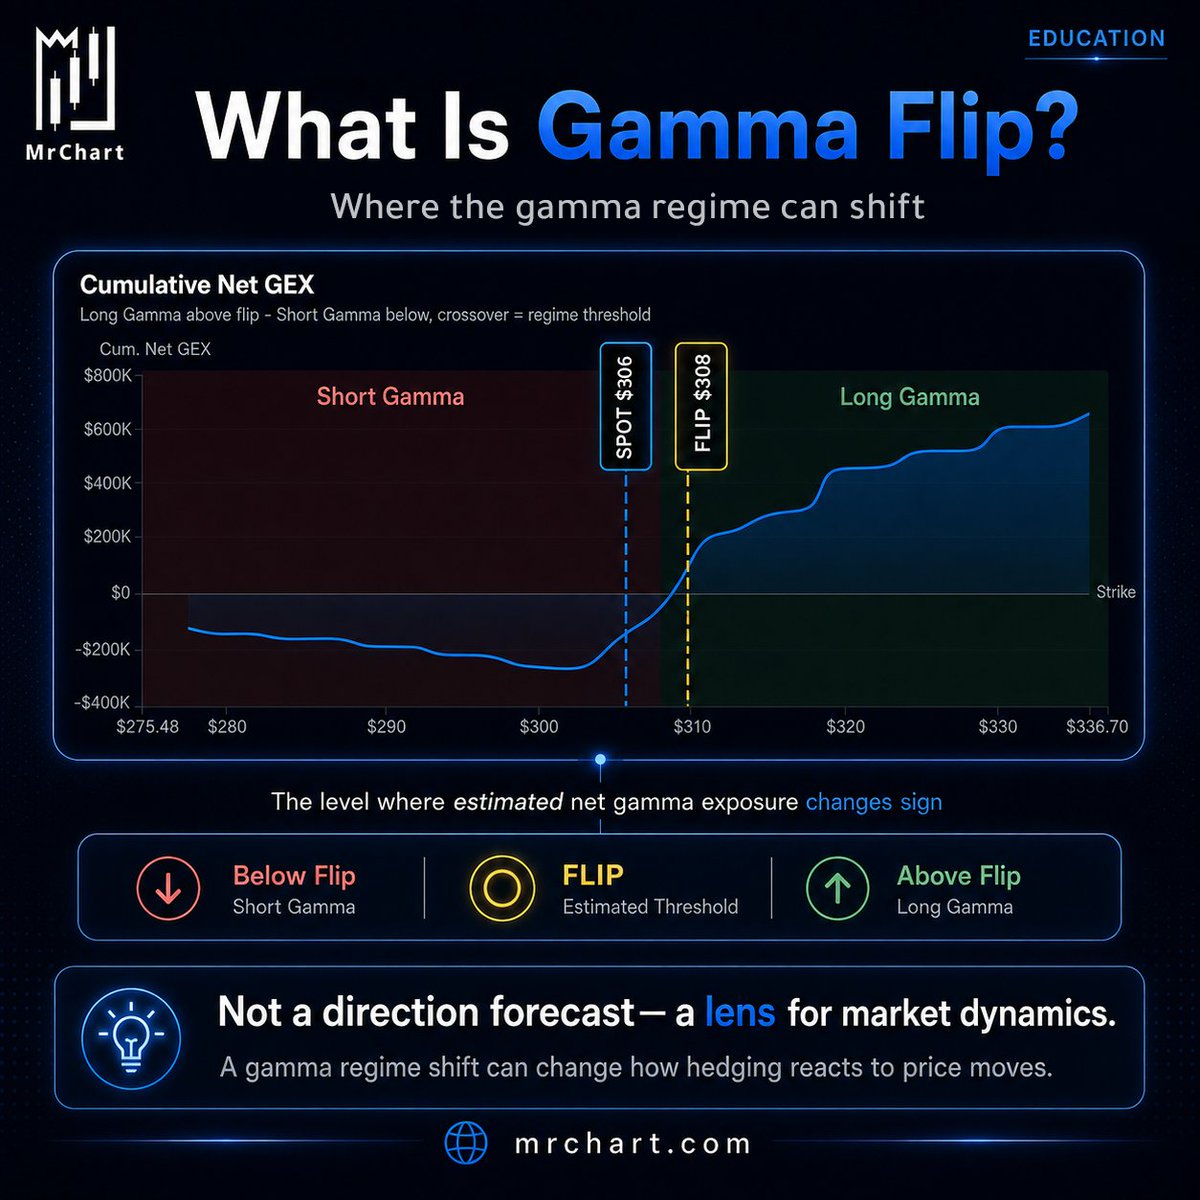
What is a Gamma Flip?
It’s the level around which estimated net gamma exposure changes sign within an options-positioning model.
Why does it matter?
A shift in the gamma regime can change how hedging reacts to price moves.
Not a direction forecast—a market-dynamics lens.
Explore advanced options data on https://t.co/fSX4tso74V
The same stock can look different depending on the lens. 🔎
MrChart Score™ brings 4 pillars into one view: Technical • Fundamental • Value • Risk
Instead of relying on one lens, MrChart gives you a more balanced read on the stock. ⚖️
https://t.co/PwJOgvZmHV
#Trading #StockMarket #Investing #FinTwit #MrChart
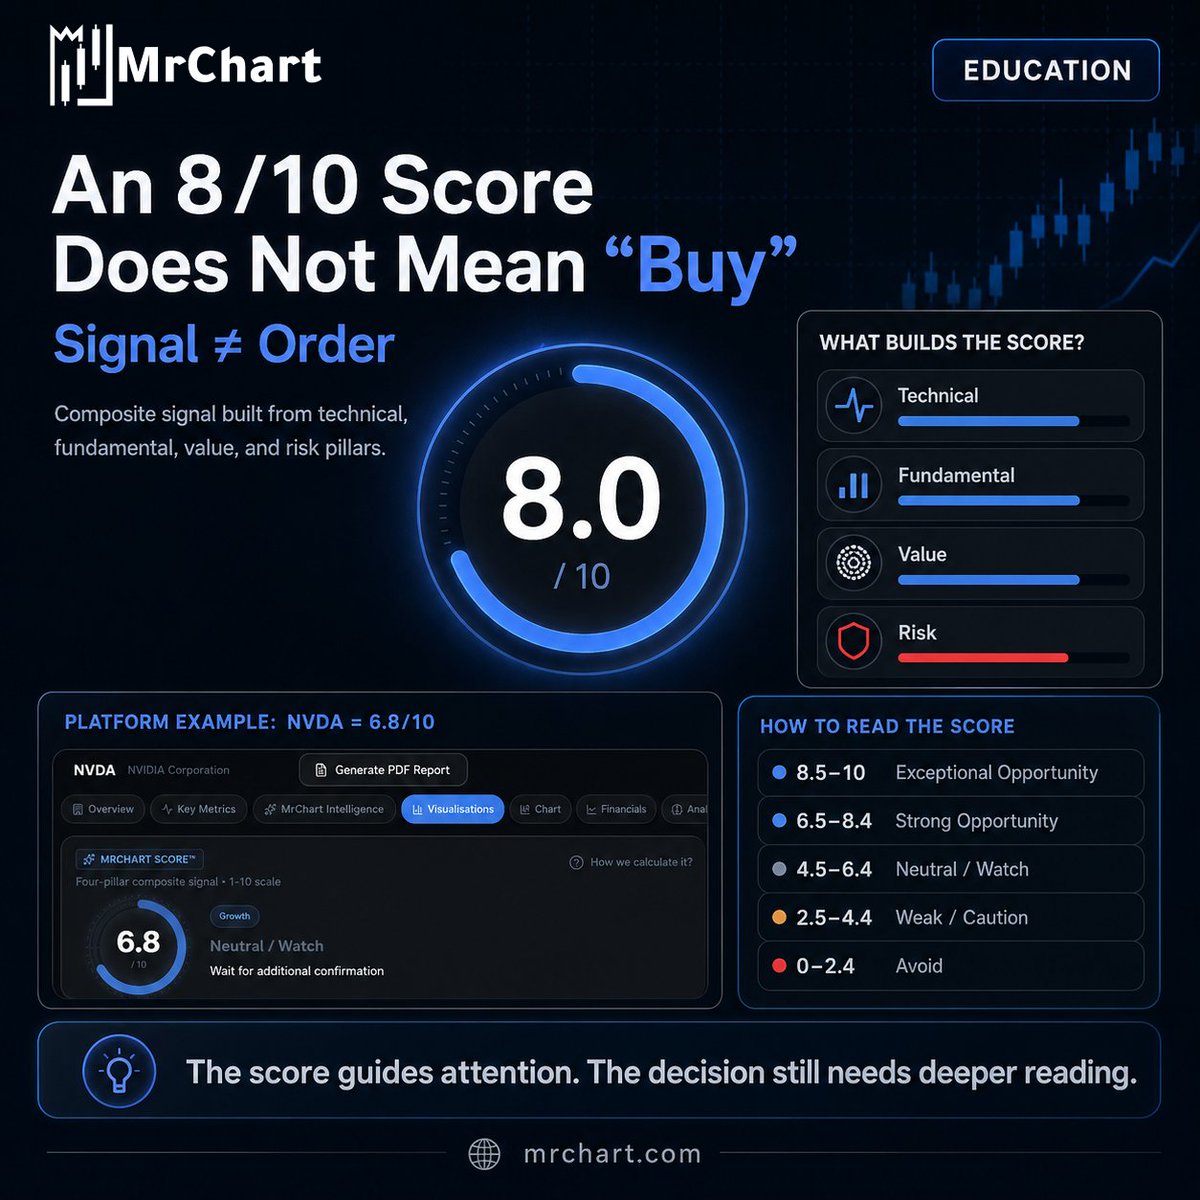
A high MrChart Score™ does not automatically mean “buy”
It’s a composite signal built from technical, fundamental, value, and risk pillars, designed to frame the stock in a broader context.
The score guides attention. 🎯
The decision still needs deeper reading. 🧠
https://t.co/fSX4tso74V
#Trading #StockMarket #Investing #FinTwit #MrChart
Fair value is not a price target.
MrChart Value™ is a quantitative estimate built from valuation models, assumptions, and adaptive weights. It is not a prediction that a stock will reach a specific price.
Confidence matters too.
Value is an analytical reference, not a price promise. 🧠
Make informed decisions with https://t.co/PwJOgvYOSn
#ValueInvesting #FairValue #FinTwit #MrChart $NVDA
One model rarely tells the whole valuation story
MrChart Value™ blends 5 independent models, with adaptive weights based on stock classification and available data. ⚙️
• Cash Flow
• Forward P/E
• Peer Comps
• Growth-Adjusted
• Asset-Based
Multiple models. One value estimate 🎯
Discover true value on: https://t.co/fSX4tso74V
#Valuation #StockAnalysis #FinTwit #MrChart $NVDA
Insider buying can be worth watching—but it isn’t a verdict on a stock’s future.
Don’t just ask: Did an insider buy?
Ask: How? How much? When?
Check the Form 4 transaction type too—not every increase in ownership is an open-market purchase. 📑
The signal matters. The context matters more. 🧠
Track insider activity with full context on https://t.co/PwJOgvYOSn
13F data offers a window into institutional holdings—but it isn’t live flow.
It shows reported quarter-end positions and how disclosed holdings changed.
Keep in mind:
• It does not tell you what an institution is buying today.
• Short positions are not reported.
Read 13F as context, not a live signal. 🧠
Analyze institutional context on https://t.co/PwJOgvYOSn
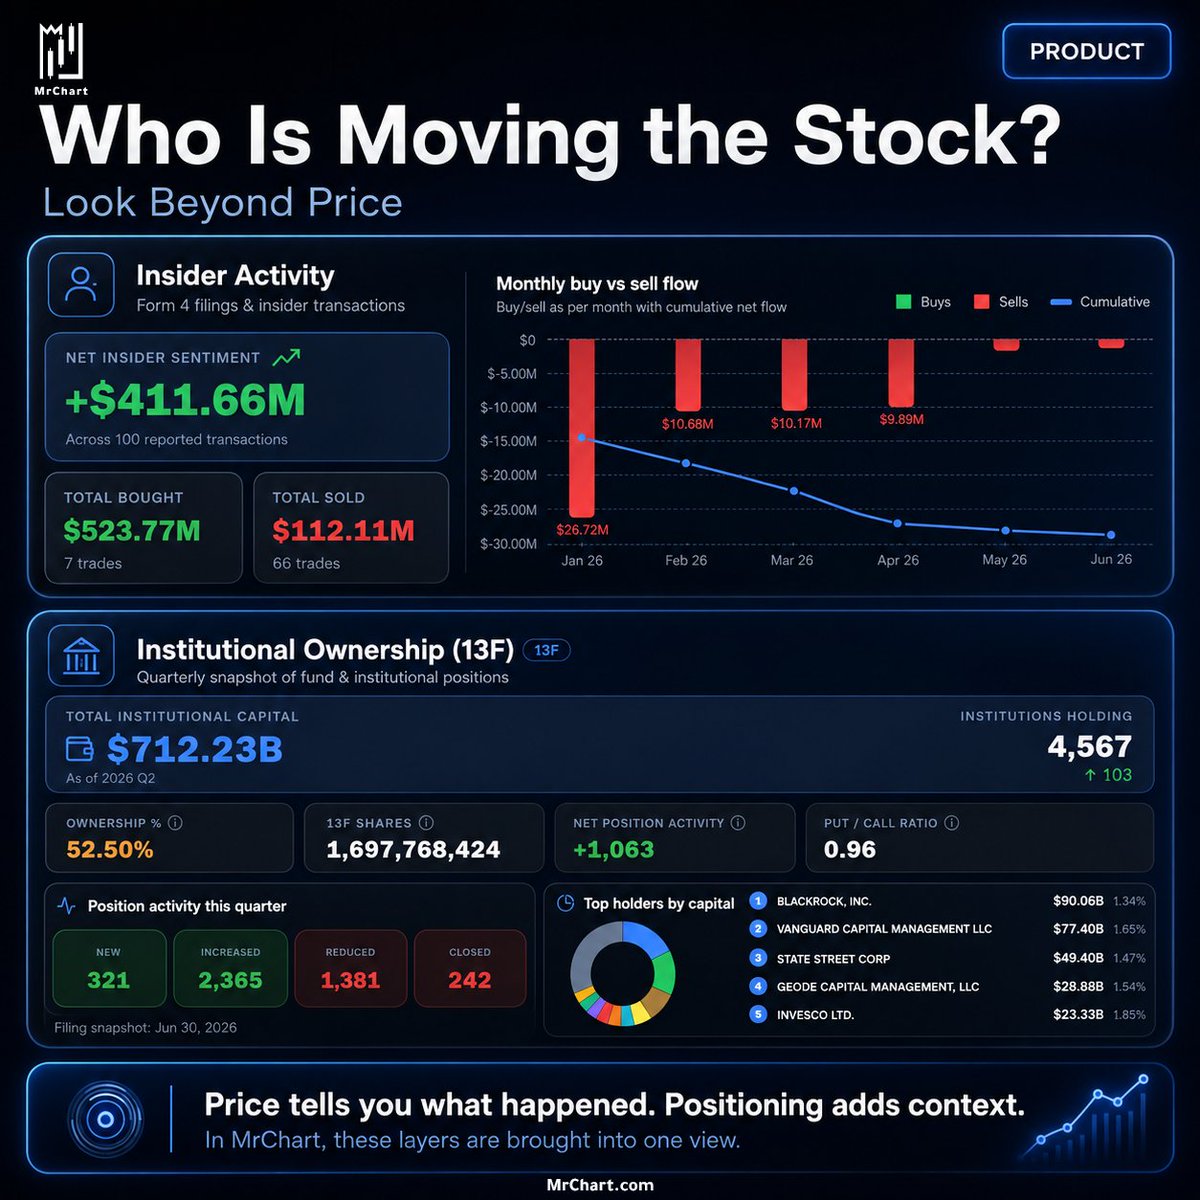
Price tells you what happened.
To understand who stands behind a stock, look beyond price:
• Insider Activity
• Institutional Ownership (13F)
In MrChart, both are brought into one view. 📊
Not live flow—but clearer context for positioning around the stock.
Explore the context: https://t.co/PwJOgvYOSn
GEX and DEX answer different questions.
DEX estimates current directional delta exposure.
GEX estimates how that exposure may change as price moves.
DEX = where exposure stands.
GEX = how it may change.
Together, they add context to positioning and hedging. 🧩
Master options dynamics with https://t.co/PwJOgvYOSn
The Fed held rates at 3.50%–3.75% in July, but the vote was 9–3, with 3 members preferring a 25 bp hike.
The key question in the minutes isn’t what the Fed decided—it’s how broad the tightening bias was inside the Committee. 🦅
Stay ahead of the market with https://t.co/PwJOgvYOSn
Fed minutes are due today at 2:00 p.m. ET. ⏱️
In July, the FOMC held rates at 3.50%–3.75%, but 3 members preferred a 25 bp hike.
Watch:
Inflation • Labor-market risks • The split inside the Committee • What could shift the September stance.
Stay updated with market dynamics on https://t.co/fSX4tso74V
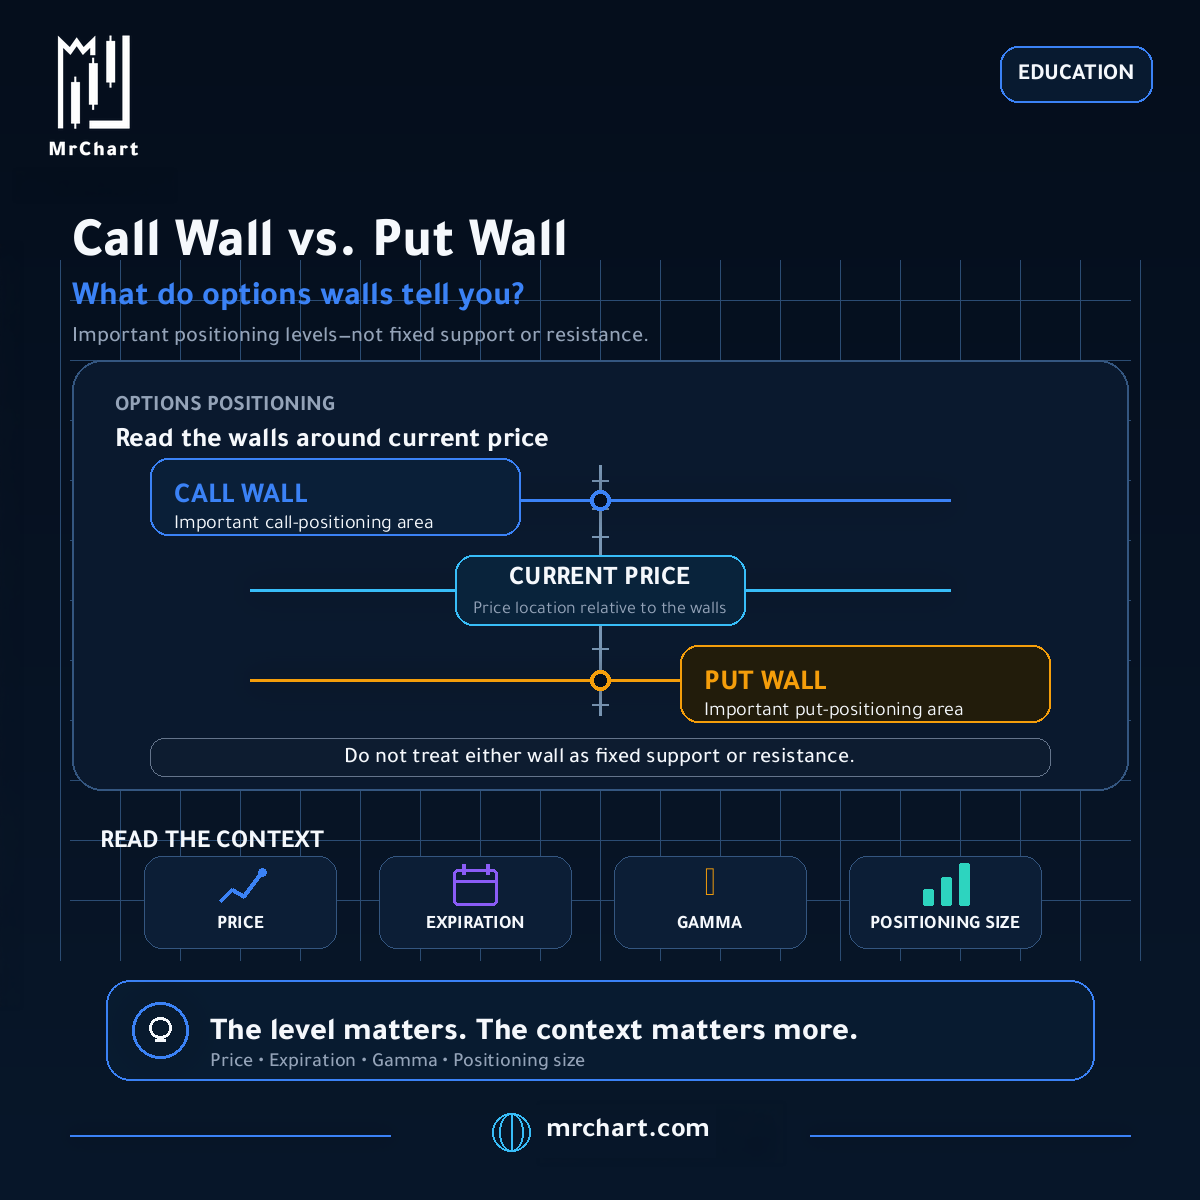
Call Wall vs. Put Wall—what do they tell you?
Both highlight important areas within options positioning.
But don’t treat them as fixed support or resistance.
Read the context:
Price • Expiration • Gamma • Positioning size
The level matters. The context matters more.
Analyze the full context with https://t.co/fSX4tsoEUt
When an index rises, are most stocks actually rising with it?
That’s where market breadth matters: it measures how widely stocks are participating in the move.
The index shows direction.
Breadth shows participation.
Don’t just watch the index. Look beneath it.
Discover the true market breadth inside https://t.co/fSX4tsoEUt
Data alone is not enough.
MrChart connects market data, analysis, and interpretation in one ecosystem—turning scattered numbers into a clearer market view.
Data → Connect → Analyze → Interpret → Insight
Explore https://t.co/fSX4tsoEUt
#Trading#StockMarket
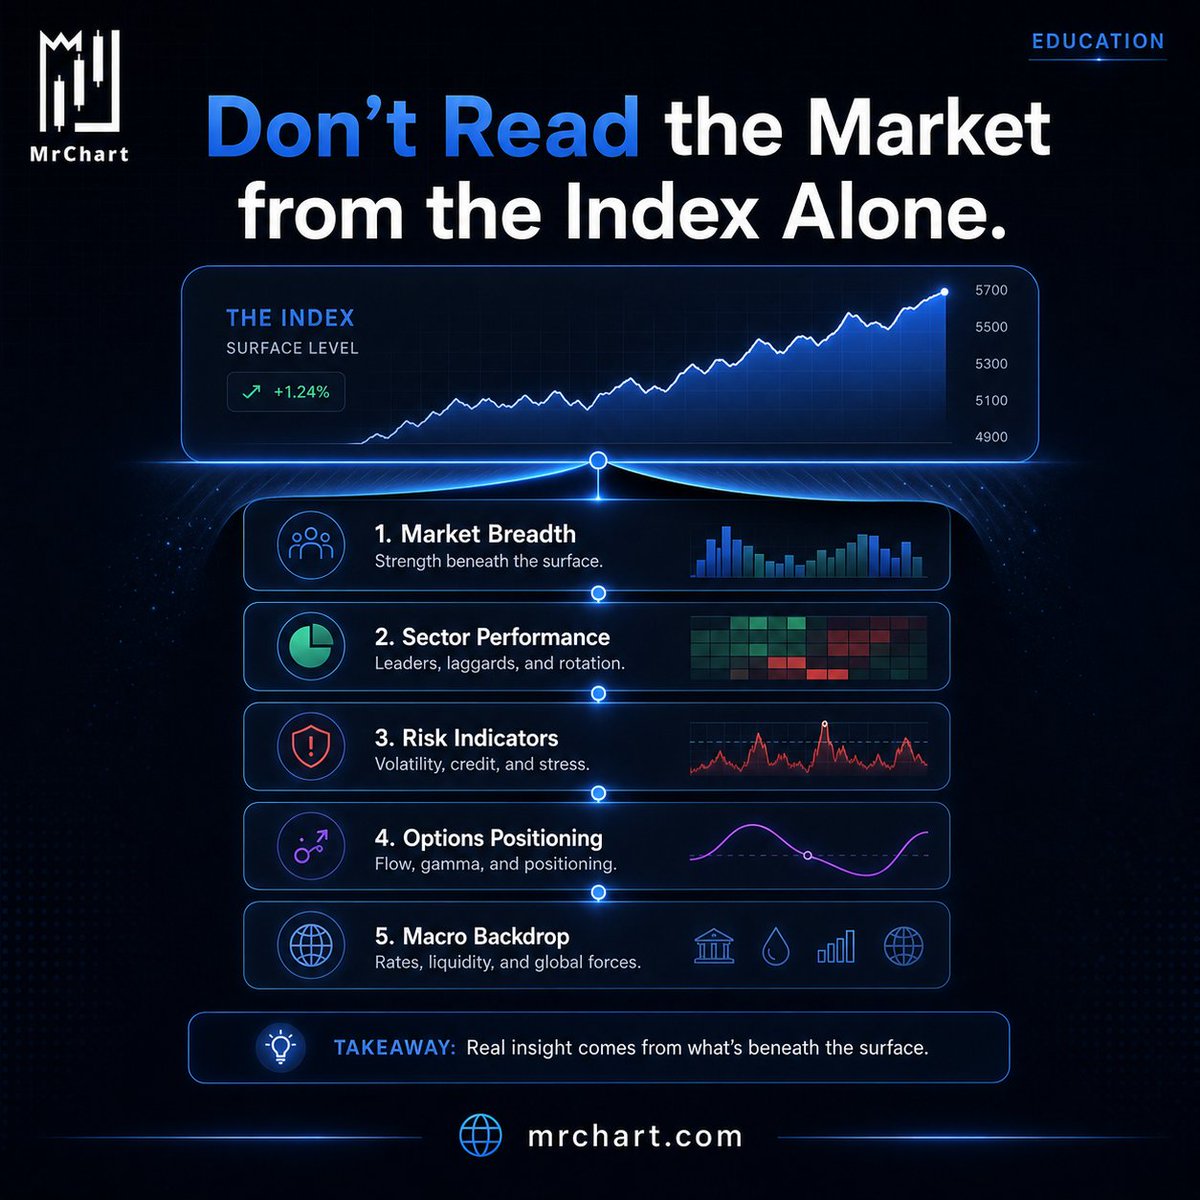
Don’t Read the Market From the Index Alone
An index moving higher doesn’t mean strength is broad across the market.
Look beneath the surface:
Market breadth • Sector performance • Risk indicators • Options positioning • Macro backdrop
Don’t just ask: Where did the index move?
Ask: What is driving the move?
🌐 https://t.co/fSX4tso74V
#Trading #StockMarket
Do you know MrChart Score™?
MrChart Score™ is a proprietary scoring engine that brings together four key lenses:
• Technical
• Fundamental
• Value
• Risk
These four dimensions are synthesized into a single 1–10 score, while keeping the underlying drivers visible.
🌐https://t.co/fSX4tsoEUt