Quick Vid on $NVDA as it tests its 200-day MA (~$204) and slipping just under it, down ~11% in October.
The 50-day ($222) is now overhead resistance.
🎥 Video: @mrflourish69
🟢 Reclaims & holds $204 → bounce toward $209 / $222
🔴 Closes below $204 → $200 in play, then the Aug low ~$197
💰 My long-term buy zone: $170–200
Key levels: 200MA $204.38 · $200 · $208.88 (today's open) · 50MA $221.72
Bull case: close back above $204, or hold $207–208 Monday. Targets $208.88, then $222. Stop: daily close under $202.
Bear case: daily close under $204 on volume. Targets $200, then ~$197. Stop: close back above $208.
⚠️ Friday close = weekend gap risk. Chop between $204–208 = no edge, stay flat.
This is the line. 📊
Coming soon https://t.co/AJw7kdARyX (in BETA)
NFA
📊Weekly Sector Report: week of Oct 26–30
Healthcare grades an A. Energy, Industrials and Staples get Bs. Financials and Materials get Cs. Chips, Tech and Crypto get Fs.
Where's the money rotating? Full breakdown👇
https://t.co/nZJ0DxpPEQ (in BETA)
NFA $spy
🎬@mrflourish69
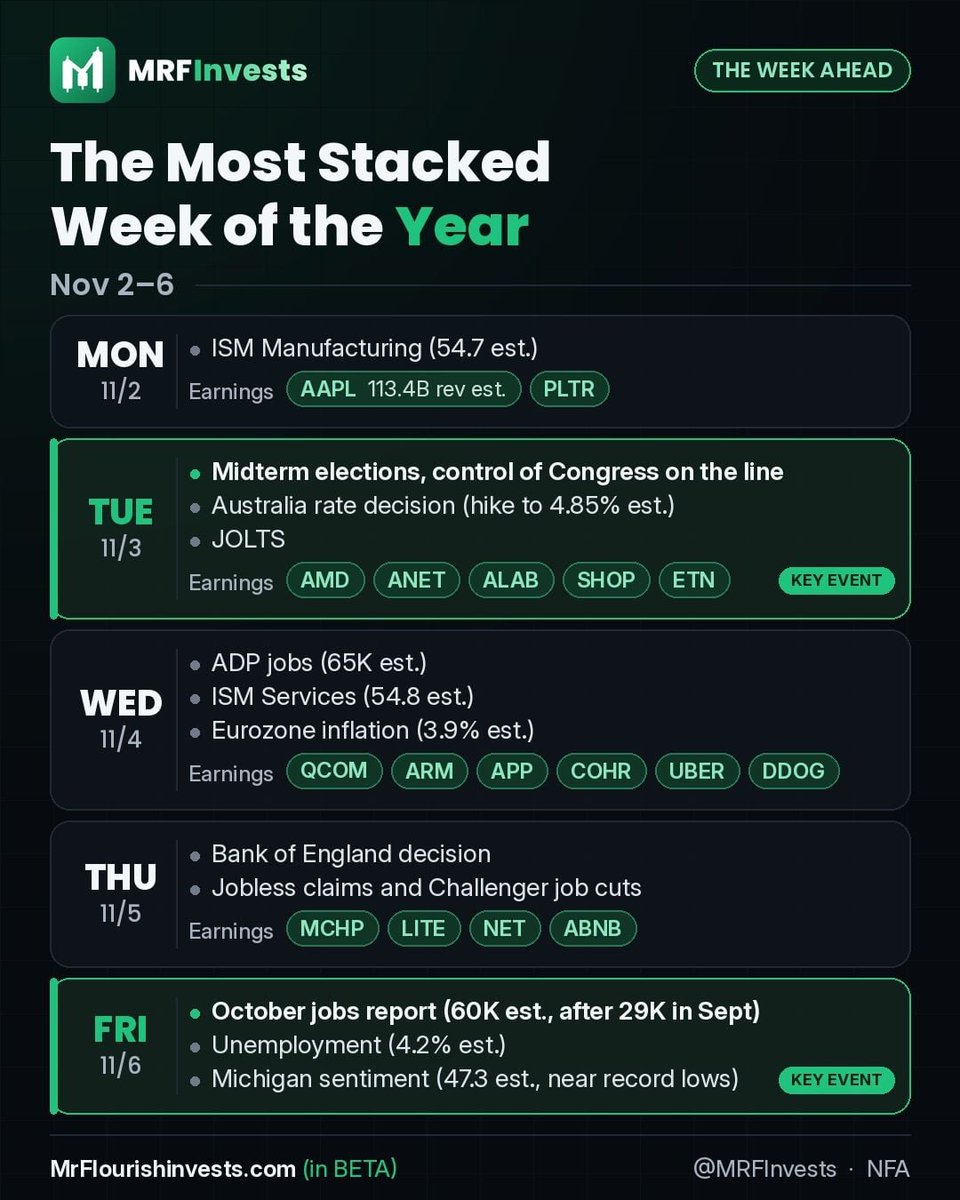
Buckle up. This might be the most stacked week of the year 🚨
Midterms, jobs data, central banks and the biggest AI earnings, all in 5 days. And it hits while tech is already bleeding and hedge funds are pulling risk off the table.
Here's the week:
MON 11/2
• ISM Manufacturing (54.7 est.)
• $AAPL earnings ($113.4B rev est.)
• $PLTR earnings
TUE 11/3
• Midterm elections: control of Congress on the line
• Australia rate decision (hike to 4.85% est.)
• JOLTS job openings
• $AMD $ANET $ALAB $SHOP $ETN
WED 11/4
• ADP jobs (only 65K est.)
• ISM Services (54.8 est.)
• Eurozone inflation (3.9% est.)
• $QCOM $ARM $APP $COHR $UBER $DDOG
THU 11/5
• Bank of England decision
• Jobless claims and Challenger job cuts
• $MCHP $LITE $NET $ABNB
FRI 11/6
• October jobs report (60K est., after 29K in Sept)
• Unemployment (4.2% est.)
• Michigan sentiment (47.3 est., near record lows)
What I'm watching is everything landing at once. Markets are pricing about an 80% chance of another Fed hike in December. A weak jobs print feeds recession fears. Hot inflation keeps the Fed from easing. And the midterms could change how Washington handles AI the same week the chip names report.
One bad guide from $AMD, $ARM or $QCOM and the AI trade takes another hit, dragging $SPY with it.
Watch the money flow, not the headlines.
https://t.co/AJw7kdARyX (in BETA)
NFA
🚨🇺🇸 THE AI SELLOFF COULD BE THE BEGINNING OF A MUCH BIGGER FINANCIAL CRISIS
I spoke with financial analyst David Lin as some of the biggest names in technology were getting absolutely hammered.
Alphabet lost roughly $500 billion in market value in a single session. Intel plunged nearly 30%. Amazon is spending tens of billions on AI infrastructure while burning through cash.
But David thinks the real danger is hiding in the debt market.
He walked me through CoreWeave, an AI cloud company carrying an estimated $50 billion in debt, with some borrowing costs reaching 15–16%.
Its projected capital spending this year is roughly THREE TIMES its expected revenue.
And now, according to the Financial Times, Anthropic could receive a junk credit rating after its IPO despite planning more than $800 billion in computing investments through 2045.
David explained how this could unravel: financing dries up, data center construction slows, chip orders fall, and suddenly the companies supplying the AI boom get dragged down with their customers.
We also discussed China's tech collapse, Bitcoin and gold falling alongside stocks, and the Federal Reserve's increasingly uncomfortable position.
Oil prices are keeping inflation elevated. A weakening technology sector could mean layoffs and slower growth. The Fed may soon have to choose which problem to confront.
David isn't predicting that every AI company will fail. He thinks the technology will survive, just as the internet survived the dot-com crash.
BUT he believes the era of borrowing almost unlimited amounts of money to build AI infrastructure could be coming to an end.
@davidlin_TV
Weekly money flow recap 💸
Where did the money flow this week? ETF segment flows for the week of Oct 26–30, 2026, including Friday's settled flows (ETF Central, data period Oct 23–30)
🟢 Top 5 inflows
1. US Large Cap +$7.07B
2. Municipal Bonds +$4.52B
3. US Government Bonds +$3.88B
4. US High Dividend +$3.82B
5. Intl IG Bonds +$3.07B
🔴 Top 5 outflows
1. Money Market −$5.44B
2. LatAm Blended Cap −$1.19B
3. US Mid Cap Value −$892M
4. Cryptocurrency −$734M
5. US Large Cap Value −$461M
Net of those 10: +$13.64B
What it says
Cash came off the sidelines again (money market −$5.44B), but this week more of it went to safety. Munis, Treasuries and international IG bonds took in about $11.5B, more than US large caps at +$7.07B. High dividend funds also pulled in +$3.82B. Crypto, LatAm and value funds saw money leave. So it's a core large-cap bid with a heavy defensive hedge, not a clean risk-on week.
AI rotation check
The rotation out of tech is starting to show. Info Tech dropped out of the weekly top 5 and saw outflows on both Thursday (−$880M) and Friday (−$163M). On Friday, money went into Financials (+$875M), Health Care (+$780M) and Energy (+$298M) instead. Health Care, Energy and Financials took in money on both days. That fits the healthcare & energy move in names like $LLY $JNJ $ABBV $XOM $CVX $COP.
�� Quad outlook: Quad 2 (Reflation) now. Growth ↑, inflation ↑
• Real GDP: 3.4% in Q3, up from 2.2% in Q2 (BEA). Atlanta Fed GDPNow starts Q4 at 3.2%
• CPI: 3.7% y/y in Sept, up from 3.4% (core 2.6%, up from 2.4%)
• PCE: 3.6% y/y in Sept, up from 3.4% (core 3.1%)
Hedgeye's public Q4 2026 call is Quad 2, and on Oct 30 they said their model sees Quad 4 (growth and inflation both slowing) as the most likely setup for Q1 2027. One early sign: inflation inside the GDP report slowed in Q3 on a quarterly basis.
What Quad 2 tends to favor: large caps, growth over value, Energy, Industrials, Financials. What tends to lag: Utilities, housing, defensives.
This week was mixed against that. Large caps in, value out and Utilities out fit Quad 2. The big bond and high-dividend inflows look more like money getting ready for Quad 4. On the watchlist, energy ($XOM $CVX $COP $EOG $TRGP) and financials fit Quad 2. Healthcare ($LLY $JNJ $ABBV $AMGN) is the defensive side that tends to hold up better if Quad 4 shows up.
🗓️ On the horizon (Nov 2–6)
Mon 11/2: ISM Manufacturing, GDPNow update, Treasury borrowing estimates, $AAPL $PLTR earnings
Tue 11/3: US midterm elections (markets open), JOLTS, $PFE $AMD $SMCI earnings
Wed 11/4: ADP jobs, Treasury refunding, ISM Services, $NVO $UBER $QCOM earnings
Thu 11/5: Jobless claims, Q3 productivity, Bank of England decision, $COP $ABNB earnings
Fri 11/6: October jobs report (8:30 AM ET), UMich sentiment
Fed: held at 3.75–4.00% on Oct 28, with two dissents in favor of a hike. Next decision Dec 9.
Data: ETF Central
#ETFs #markets #macro
Coming soon https://t.co/AJw7kdARyX (in BETA)
NFA
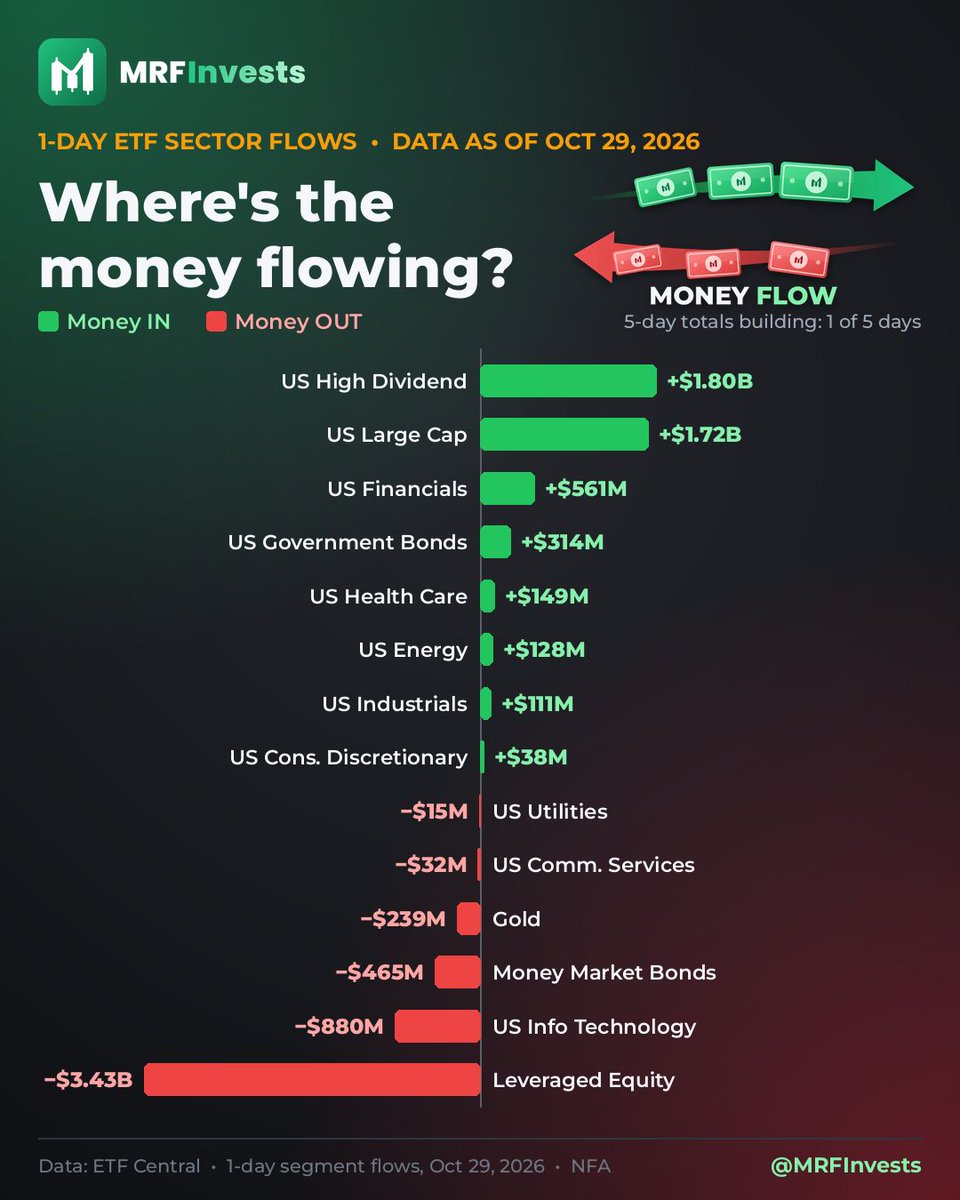
Money flow check 💸
1-day ETF sector flows (data as of Oct 29)
🟢 IN: US High Dividend +$1.80B, US Large Cap +$1.72B, Financials +$561M
🔴 OUT: Leveraged Equity −$3.43B, Info Tech −$880M, Money Market −$465M
📊 1-week (Oct 22–29): US Large Cap +$8.40B, Money Market −$5.36B
⏳ 5-day totals building (1 of 5 days), no streaks yet
Read: money left leveraged bets and tech for dividend payers, large caps and banks. Less risk, still in stocks.
Rotation out of AI/chips into healthcare & energy? A small yes for the day. Health Care +$149M and Energy +$128M came in while Info Tech lost −$880M.
#ETFs #MoneyFlow
Coming soon https://t.co/AJw7kdARyX (in BETA)
NFA
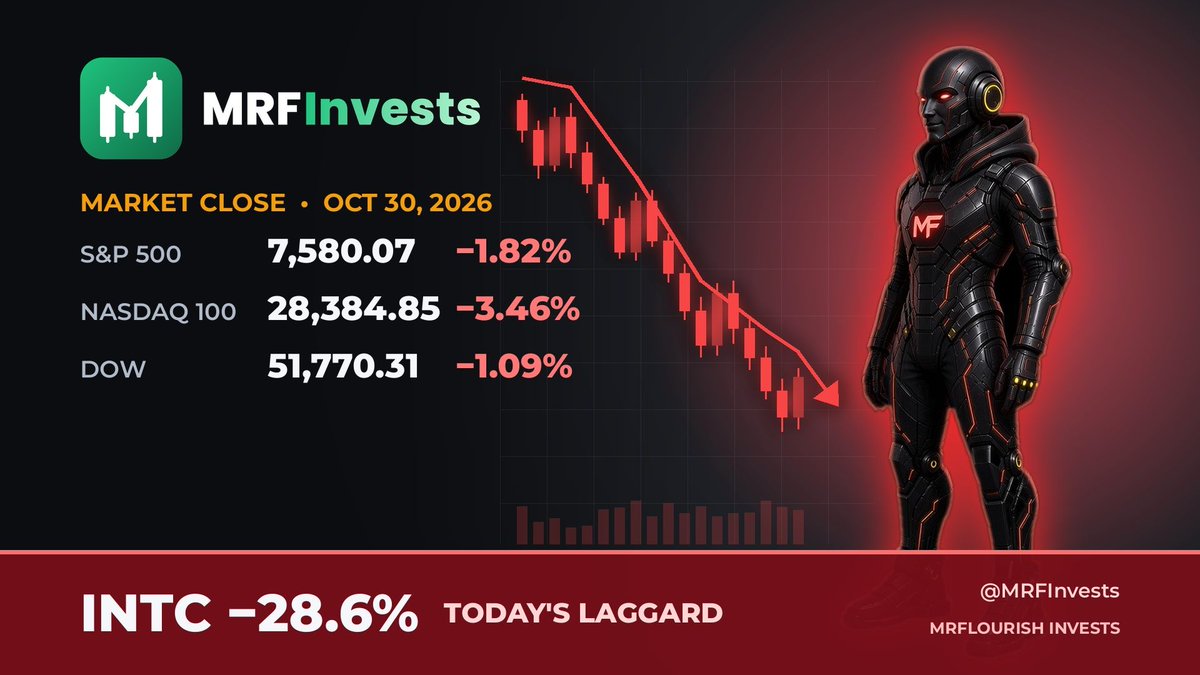
Market update 📈
Oct 30, 4:00 PM ET
🚨 $INTC −28.6% to $65.76 on a weak Q4 guide, dragging chips and servers ($DELL −10.8%) as the Nasdaq 100 fell 3.46%
S&P 500 7,580.07 (−1.82%)
Nasdaq 100 28,384.85 (−3.46%)
Dow 51,770.31 (−1.09%)
Leaders: $LLY +3.2%, $XOM +2.2%
Laggard: $INTC −28.6% after its Q4 revenue and profit guide missed on PC weakness from memory costs
⏰ Next: $AAPL and $PLTR report Monday after the close
#trading #markets
Coming soon https://t.co/AJw7kdARyX (in BETA)
NFA
📊 $SPY 0DTE Gamma Map
• Spot: 758.62
• Net gamma: −$7.03B
• Call wall: 760
• Put wall: 755
• Flip: none in range
Gamma is negative across the board today, so moves can stretch instead of getting absorbed.
760 is the ceiling right overhead: reclaim it and 765, then 770, are next.
755 is the floor; lose it and the drop can speed up toward 750.
Coming soon https://t.co/AJw7kdARyX (in BETA)
NFA
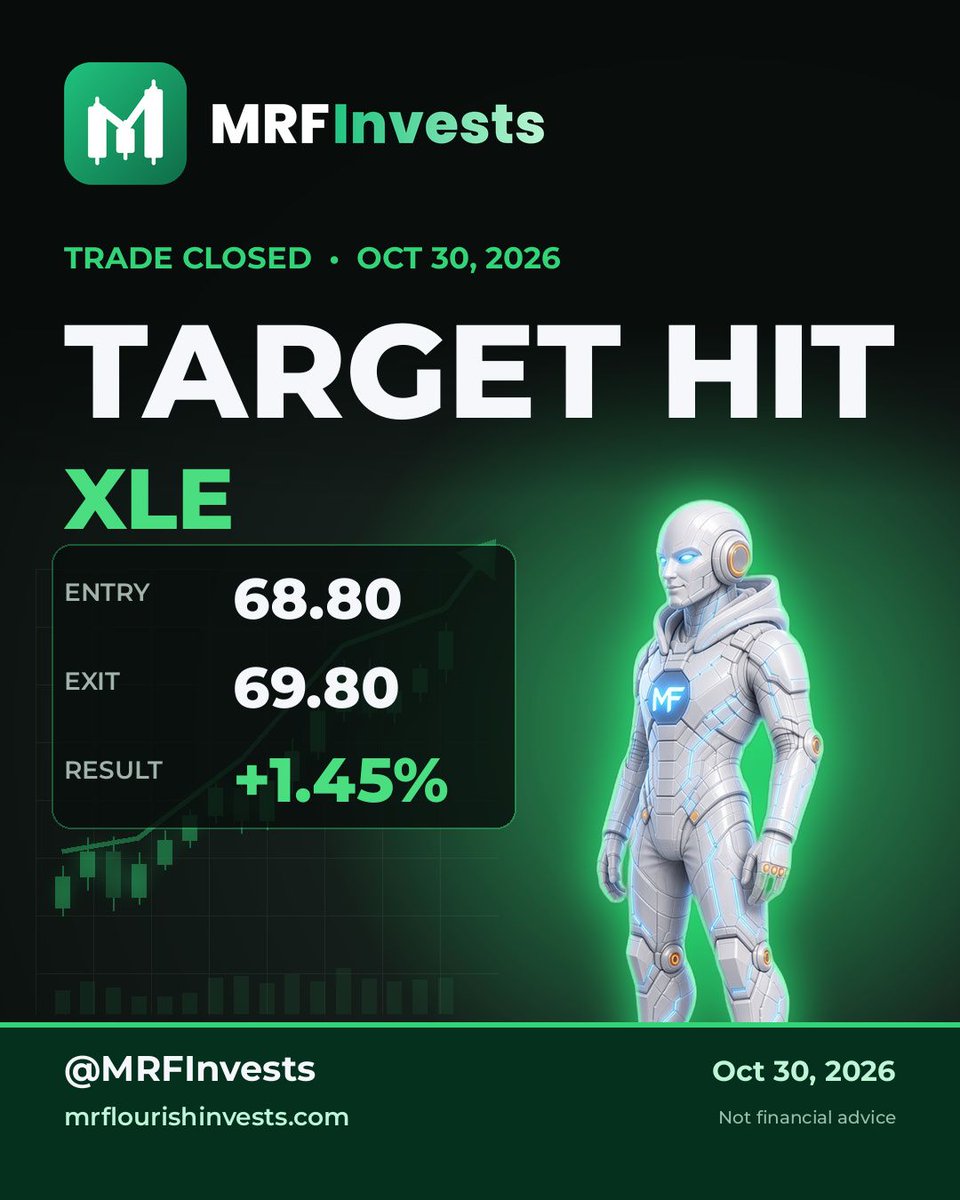
📈 Trade closed ✅
$XLE hit our target right after the open.
Entry $68.80 ➡️ Exit $69.80
Result: +1.45% 🎯
Energy held up into $XOM and $CVX earnings and we took the win off the table.
Coming soon https://t.co/nZJ0DxphPi (in BETA)
NFA
📈 Market update
Oct 29, 4:00 PM ET
🚨 $GOOGL −12.6% to $283.82, its worst one-day drop on record, after a Q3 search miss and −$9.07B free cash flow
📉 After the close: $AMZN fell 7%+ on a Q3 miss, $INTC about −17% to −20% on a weak Q4 guide
S&P 500 7,720.39 (−0.30%)
Nasdaq 100 29,402.51 (−1.38%)
Dow 52,342.56 (−0.25%)
Leaders: $LLY +6.6%, $META +2.0%, $AAPL +1.5%
Laggard: $GOOGL −12.6% as its Q3 search miss revived AI spending worries
⏰ Next: $XOM reports Friday before the open
#trading #markets
Coming soon https://t.co/AJw7kdARyX (in BETA)
NFA
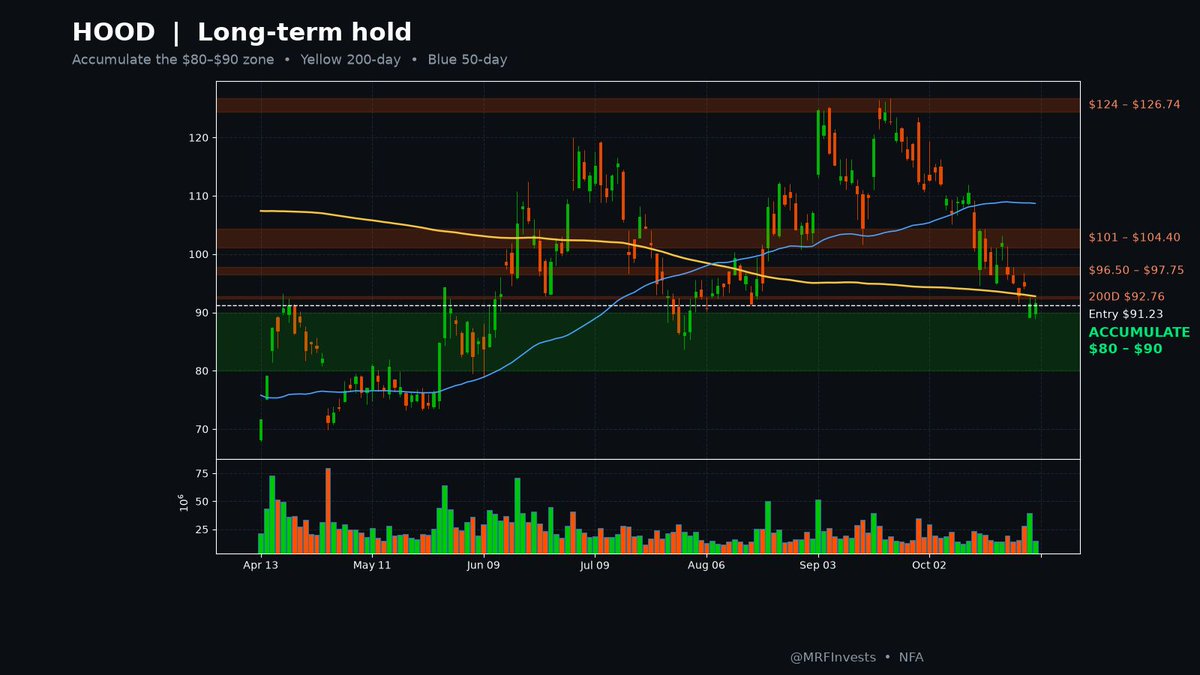
Today I added $HOOD to my LONG-TERM portfolio at $89.50📈
This isn't a swing trade. This is a hold.
The plan🔑
• Entry: $89.50
• Accumulate zone: $80–$90
• I'm buying more on any dips into that zone, not chasing green days
Why I'm holding
• $HOOD is down ~40% from its $150.47 high
• It's sitting right on the 200-day (~$92.76), so the sellers have done a lot of the work
• This is a long-term bet on where the platform is going, not on next week's candle
Levels I'm watching👀
• Resistance: $92.76 (200-day), $96.50–$97.75, $101–$104.40, then $124–$126.74
• Accumulate: $80–$90
Patience pays. Dips are gifts if the story is intact.
Coming soon https://t.co/AJw7kdBpov (in BETA)
NFA
I just sold covered calls on $NVDA🎯
The trade🔑
• Sold: Sep 17, 2027 $225 calls
• Premium: $29.85 per share collected, ~14% of the stock price (~$213.66)
• If $NVDA gets called away at $225, that's an effective exit of ~$254.85 counting the premium
Why I sold them
• I expect $NVDA to pull back to the ~$200 area
• The 200-day is sitting at ~$203.98, right where I think it's heading
• I'd rather get paid to wait than sit on shares doing nothing
ADD SHARES ZONE🟢
• $170–$200 is my new buy zone
• Pullbacks into that zone are where I'm adding more
Levels I'm watching👀
• Resistance: $221.92 (50-day), then $236–$243.37 (the October high)
• Support: ~$204 (200-day), then $189.59–$194.30
• Add zone: $170–$200
Collect premium. Buy the dip. Repeat.
Coming soon https://t.co/AJw7kdARyX (in BETA)
NFA
$GOOGL GOT SMOKED AFTER EARNINGS... Down 11%+🔻
Google Cloud literally doubled and the stock still got taken out back. So is this the AI capex wall finally showing up, or the best Mag 7 discount we get all year?
Key Points🔑
• Revenue: $127.6B (+25% YoY) vs $128.2B expected. Miss
• Adj EPS: $2.67 vs $3.02 expected. Miss (GAAP EPS $2.12 vs $2.87 a year ago)
• Google Cloud: $30.7B (+103% YoY) vs ~$28.7B expected. Beat
• Search & other: $63.35B (+12%) vs ~$64.96B expected. Miss
• YouTube ads: $11.21B (+9%) vs ~$11.34B expected. Miss
• Subscriptions, platforms & devices: $14.29B (+11%)
• Google Services total: $96.3B (+11%)
• Operating margin: 31.8% (vs ~30.5% last year). Op income $40.6B vs $43.2B expected
• Q3 capex: $51.4B (+114% YoY)
• Free cash flow: -$9.1B (2nd straight negative quarter)
• 2026 capex guide: $195B-$205B (unchanged). 2027: "increase significantly"
• Cloud backlog: $561B
• Buybacks: $0 this quarter. Dividend: $0.22/share declared
• Stock: ~$286, down ~12.0% on the day, low of $280.36 (-13.7%)
What was BEARISH🐻
1. First double miss in almost 4 years
Revenue, EPS and operating income all came in light. It's Alphabet's first top-and-bottom-line miss in nearly four years, and the stock was priced for a beat.
2. Search slowed down
Search grew 12% but missed estimates by about $1.6B. Management pinned part of the slowdown on more people using AI Mode, where ads are still being tested. That is exactly the "AI eats Search" fear bears have been yelling about.
3. Cash burn got worse
FCF came in at -$9.1B vs roughly -$2.7B expected. That's two negative quarters in a row from what used to be one of the biggest cash machines on the planet.
4. Capex has no ceiling
$51.4B spent in one quarter, 2026 guide held at $195-205B, and 2027 is going "significantly" higher. The real number doesn't come until the Q4 call, so the market is left to guess. And it's guessing big.
5. Paying for it with debt and new shares
Zero buybacks. Instead they sold about $12.4B of stock through an ATM program and raised $28.7B in new notes. Long-term debt is $125.1B vs $46.5B at the end of 2025, and the share count is up ~1.7% since December. That's dilution, not shareholder returns.
6. Ads missed across the board
Total ad revenue was $82.0B vs ~$83.4B expected. YouTube ads grew 9%, down from 13% last quarter, and Network was basically flat at +1%.
7. Near-term margin pressure
The CFO flagged Cloud margin headwinds in Q4 from renting third-party compute, a bigger FX hit, and a tough Search comparison.
8. The chart broke
It gapped straight through the $315-$321 zone that held as support in July and again earlier this week. It's now below the 50, 100 and 200-day, and the 50-day is slipping under the 200-day. Volume is running ~2.7x normal.
What's still BULLISH🐂
• Google Cloud +103% to $30.7B with a 36.2% operating margin (vs 23.7% a year ago). Cloud op income more than tripled to $11.1B
• $561B Cloud backlog, and they expect just over 55% of it to turn into revenue over the next 24 months
• TPU systems sales are now a "meaningful" contributor to Cloud. Real competition for $NVDA
• Search query growth is the fastest in 5 years per management. Usage isn't the problem, monetization timing is
• Gemini app hit 1B users. First-party model APIs are processing ~32B tokens per minute, 4x+ a year ago
• Total revenue still +25%, on a half-trillion-dollar run rate
• Q3 capex actually came in under the ~$55.1B estimate
• Ads in AI Mode are rolling out to international markets
• Operating income still grew 30% YoY
What Wall Street is secretly saying
• The $2.12 GAAP EPS includes an $8.7B loss on equity stakes. That knocked about $0.55 off EPS. Strip it out and you get the $2.67 adjusted number, which STILL missed.
• Flip side: last quarter's $9.11 EPS was juiced by roughly $99B in gains on those same stakes (SpaceX, Anthropic). So the trailing P/E looks cheaper than the core business really is. Don't let the screener fool you.
• The "$300B+ capex in 2027" number floating around is an analyst estimate, not company guidance. Alphabet hasn't given one yet.
• This isn't only a $GOOGL story. $QQQ is red, semis are down, and it reopened the whole "does AI spend ever pay back" debate. But $MSFT rallied after hours on its own cash flow beat, so the market is picking winners, not dumping AI blindly.
The Bull and Bear Case from MrFlourish
Bull case: Cloud is a monster. Doubling revenue at a 36% margin with a $561B backlog is not a broken company. If AI Mode ads catch up and TPU sales ramp into 2027 like they're guiding, this dip looks silly a year from now.
Bear case: The core ads engine slowed while spending went parabolic, and now they're borrowing and issuing shares to fund it. Until FCF flips positive and Search reaccelerates, rallies probably get sold.
Things to keep your eyes on👀
• $272-$280 support (the March/April lows plus today's low). Lose $272 on a close and I step aside
• $315-$321 is now resistance. Reclaim it and the gap back to $324.89 can fill
• Whether the 50/200-day death cross confirms at the close
• The actual 2027 capex number on the Q4 call
• AI Mode ad monetization and whether FCF turns positive
Not catching the knife here. I want to see $280 hold first.
Coming soon https://t.co/AJw7kdARyX (in BETA)
NFA
🚨 Trade alert
Oct 29, 9:54 AM ET
BOUGHT $XLE @ $68.80
🎯 Target $69.80 (just under the Oct 26 high)
🛑 Stop $67.95 (under Tuesday's low + pivot support)
Why: Energy is the top Quad 2 sector in our playbook, and we buy energy dips, not records. $XLE pulled back to its $68.50 pivot while tech sold off on $GOOGL's miss.
⚠️ $XOM and $CVX report Friday before the open, so a gap is possible.
For daily alerts, sign up at https://t.co/AJw7kdARyX (in BETA)
NFA
📈 Market update
Oct 28, 4:00 PM ET
🚨 $GOOGL MISSED Q3: EPS $2.12 vs ~$3.02 expected, revenue $127.58B vs ~$128.2B
📉 $GOOGL about −9% after hours near $294.63, even with Google Cloud +103%
S&P 500 7,743.98 (+0.28%)
Nasdaq 100 29,813.16 (+0.55%)
Dow 52,475.10 (+0.19%)
Leaders: $BE +4.4%, $INTC +1.9%, $GOOGL +1.3%
Laggard: $HOOD −3.3% as a crypto slump drove a Q3 profit miss
#trading #markets
Full brief 👇
https://t.co/CQBEO41hBb
Coming soon https://t.co/AJw7kdARyX (in BETA)
NFA