#Bitcoin found the bottoms in history at 44%-46% deviated below the Lower Envelope Band.
We are now at 46% below the Lower Envelope band.
Have we already bottomed in?
#BTC $BTC #Cryptos
#Bitcoin Today's Twitter analysis
The weekly Stochastic signals the beginning of a long Bull Run, like the 4 previous historical Bull Runs.
My other analyses on my Telegram, available to anyone who signs up here :
→ https://t.co/qmEzYt1iz7
or → https://t.co/5dxscNAYBn
$BTC #Bitcoin
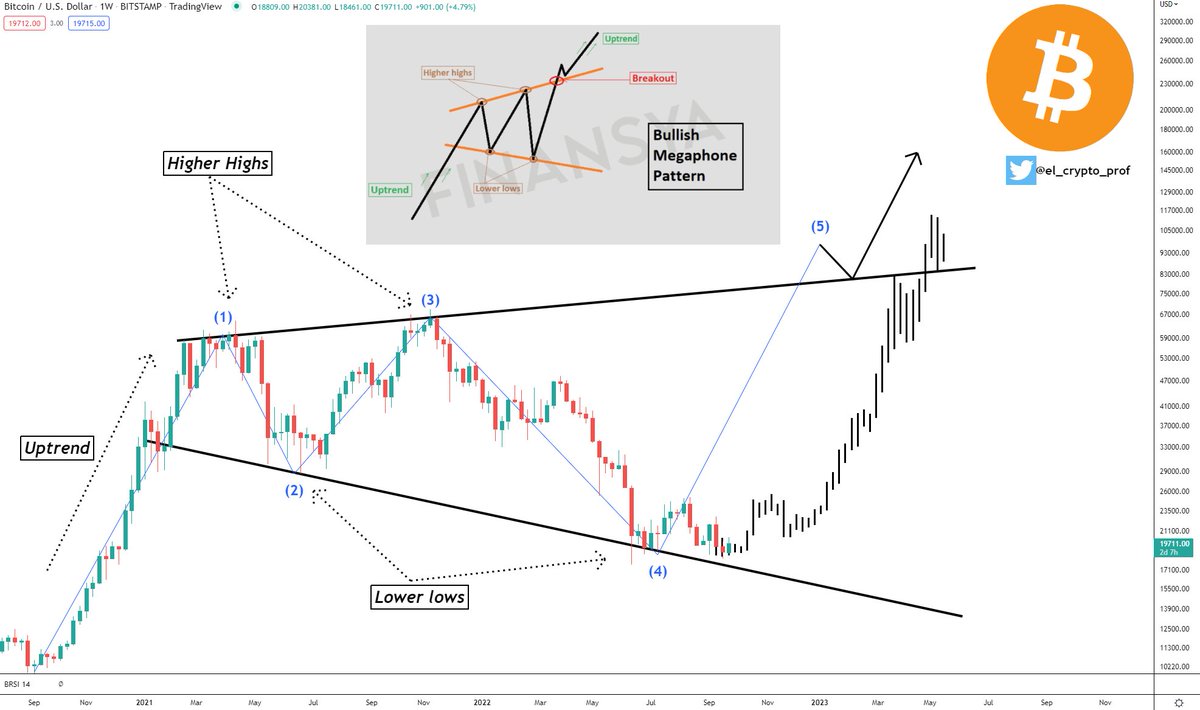
Textbook "Bullish Megaphone Pattern" on #Bitcoin and the majority is bearish.
Remember: Things can change fast, especially when the fewest expect it.
#BTC / #SP500 Ratio Divergence History
This chart shows weekly RSI divergence history since 2015 for Bitcoin/SP500 ratio.
We have a bullish divergence right now.
Which means that in a case of a bounce, #Bitcoin & #Cryptos market could outperform the stock market.
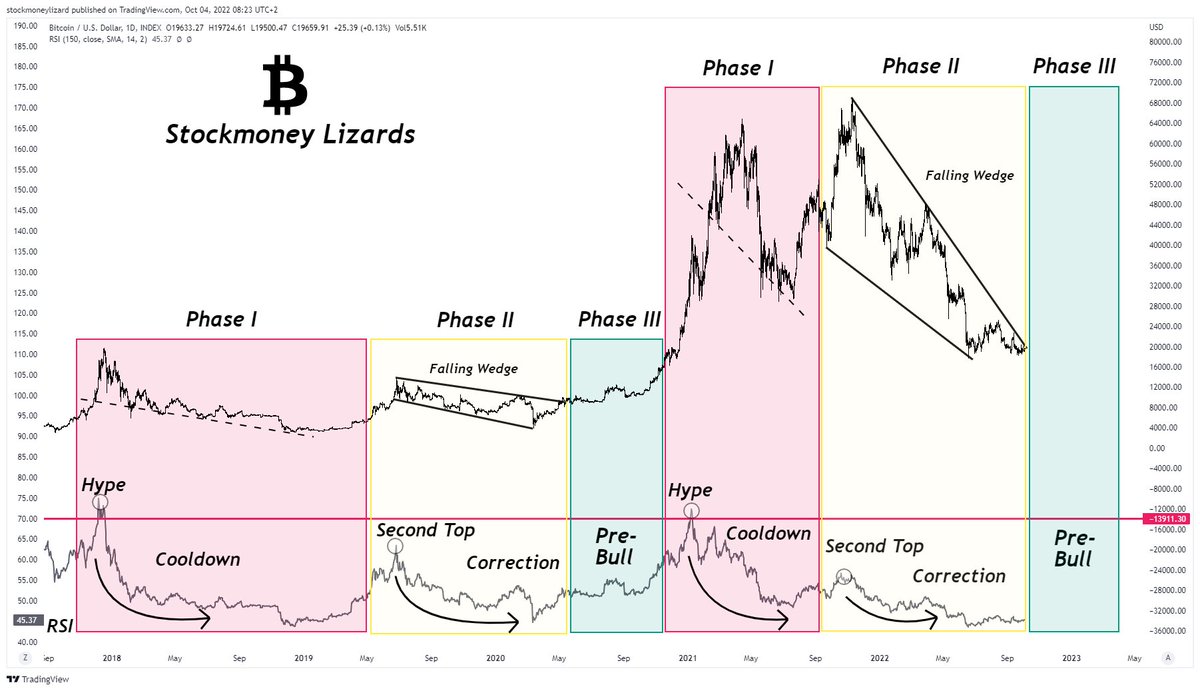
Possible #Bitcoin Wyckoff:
Matching pts:
~2 more LowerLows after SC🔴 (ST in Phase B🟡& Spring🟢)
~LowerHigh🟠above AR level
~Soaring when $BTC hits supports
Discrepancy:
~Large zone between resistance lines
✡️“New RALLY always starts with disbelief”- Tardigrade
#Bitcoin#BTC
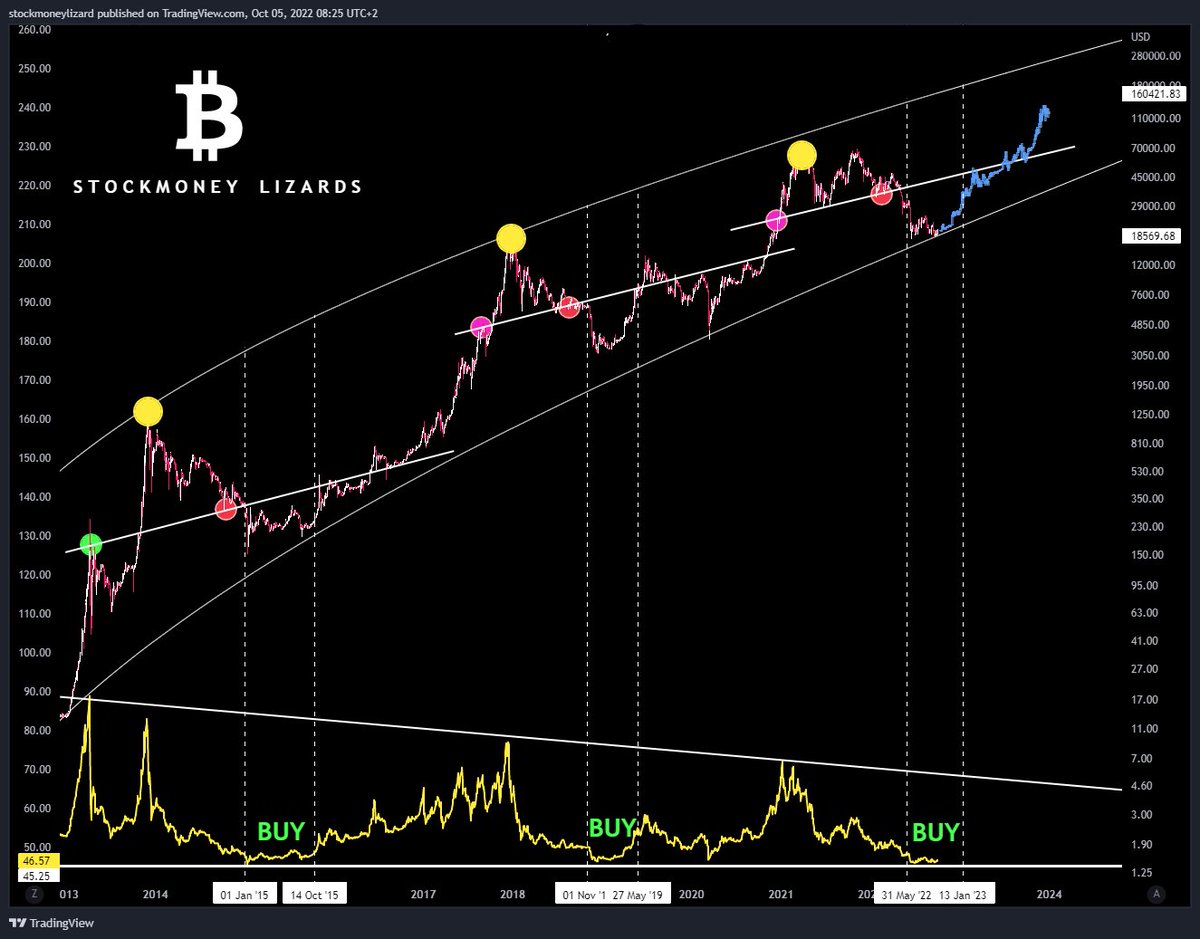
#Bitcoin a look in the past shows as the anatomy of the 2-level supports of the bubbles.
The 2 pre-ATH peaks are macro support levels for later corrections.
Currencies around the world are tumbling - Bitcoin stays here on this strong support and is getting accumulated 💯
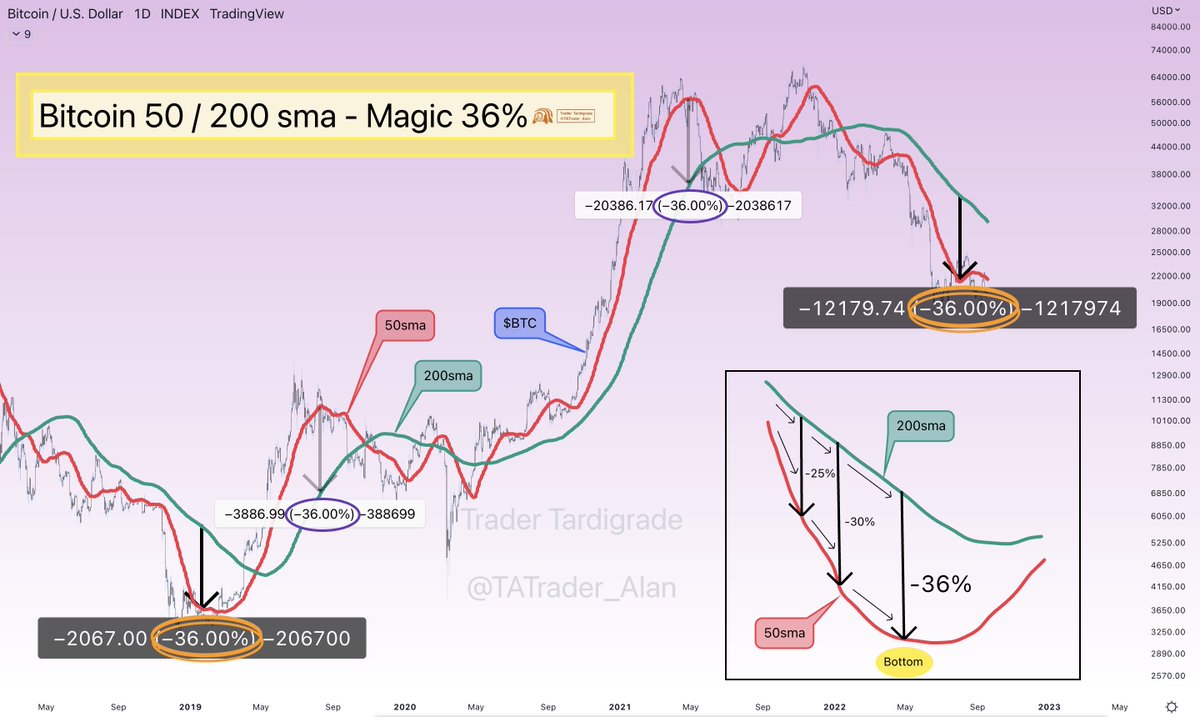
Interesting relationship among 36%, 50 sma, 200 sma and the top or bottom in #Bitcoin daily chart.
When the difference between 50 and 200 sma gets separated until 36% apart, the bottom or top is in.
If this is true, the BOTTOM was in already.
#Bitcoin Long Trading Strategy.
You only need two indicators!
Buy when prices crosses the lower bound 🟢 and sell when price crosses upper bound 🔴. Used indicators Keltner Channels + RSI (timeframe 14days).