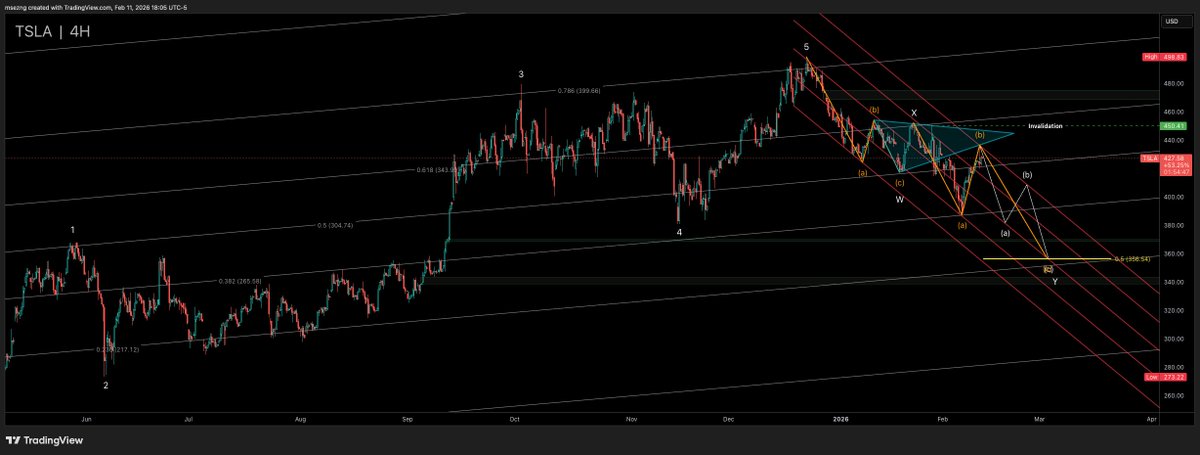
@rexstocks Well, I think we all know Tesla will eventually head a lot higher in the future. These down moves are just part of the process. You definitely need a lot of patience to be a Tesla shareholder 😅
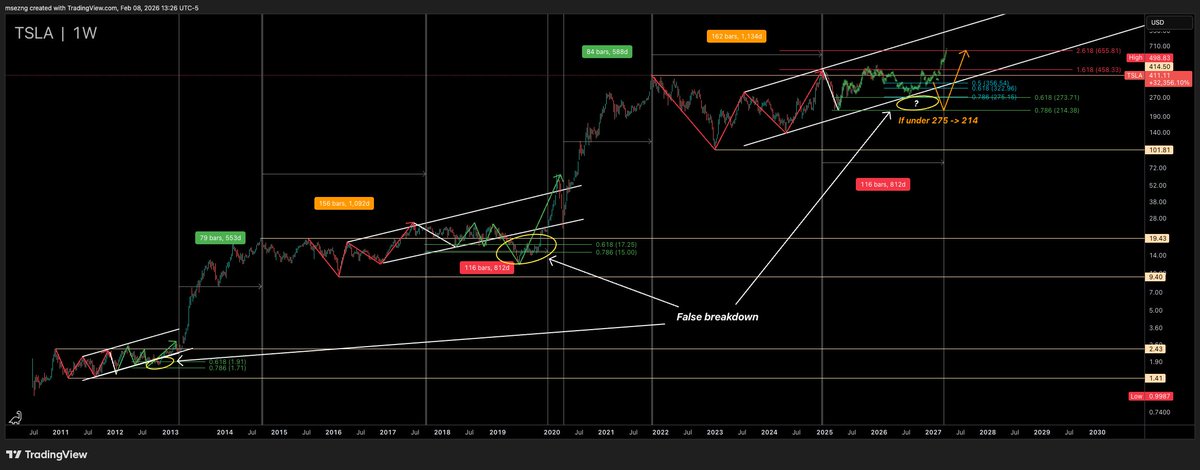
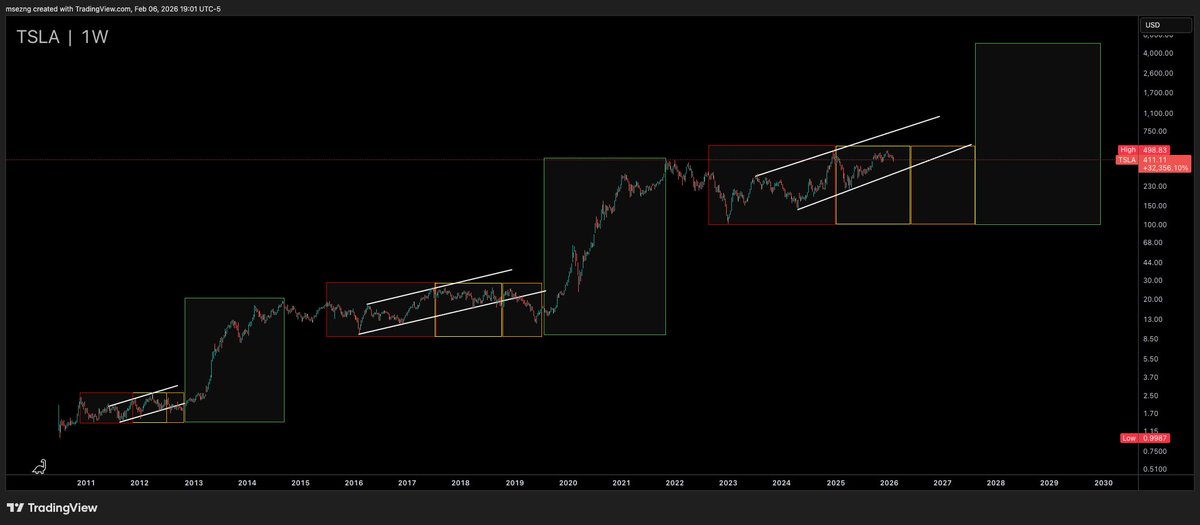
$TSLA This is purely speculation, but some more detailed analysis based off previous parabolic bull cycle. Hopefully, in this chart, you can see more clearly the similarities.
In the last 2 cycles, you can see a W and an M, which form a bearish (W) and bullish (M) harmonic pattern. They both broke down from the white ascending channel before starting the actual parabolic move.
If the current cycle follows anything remotely similar, I think 275 is not out of the question. If that holds, it can go for a new ATH, and if not, which is right at the bottom of the ascending channel, it can break down all the way to $214. From there, the real upside moves happen after capitulation.
$TSLA This is purely speculation, but some more detailed analysis based off previous parabolic bull cycle. Hopefully, in this chart, you can see more clearly the similarities.
In the last 2 cycles, you can see a W and an M, which form a bearish (W) and bullish (M) harmonic pattern. They both broke down from the white ascending channel before starting the actual parabolic move.
If the current cycle follows anything remotely similar, I think 275 is not out of the question. If that holds, it can go for a new ATH, and if not, which is right at the bottom of the ascending channel, it can break down all the way to $214. From there, the real upside moves happen after capitulation.
@MuskConomy This is the second time you commented cope on my post and both time I dont have an open position on Tesla, so what exactly do I need to cope for?
$TSLA This is purely speculation, but some more detailed analysis based off previous parabolic bull cycle. Hopefully, in this chart, you can see more clearly the similarities.
In the last 2 cycles, you can see a W and an M, which form a bearish (W) and bullish (M) harmonic pattern. They both broke down from the white ascending channel before starting the actual parabolic move.
If the current cycle follows anything remotely similar, I think 275 is not out of the question. If that holds, it can go for a new ATH, and if not, which is right at the bottom of the ascending channel, it can break down all the way to $214. From there, the real upside moves happen after capitulation.
$TSLA This is purely speculation, but some more detailed analysis based off previous parabolic bull cycle. Hopefully, in this chart, you can see more clearly the similarities.
In the last 2 cycles, you can see a W and an M, which form a bearish (W) and bullish (M) harmonic pattern. They both broke down from the white ascending channel before starting the actual parabolic move.
If the current cycle follows anything remotely similar, I think 275 is not out of the question. If that holds, it can go for a new ATH, and if not, which is right at the bottom of the ascending channel, it can break down all the way to $214. From there, the real upside moves happen after capitulation.