#BTC
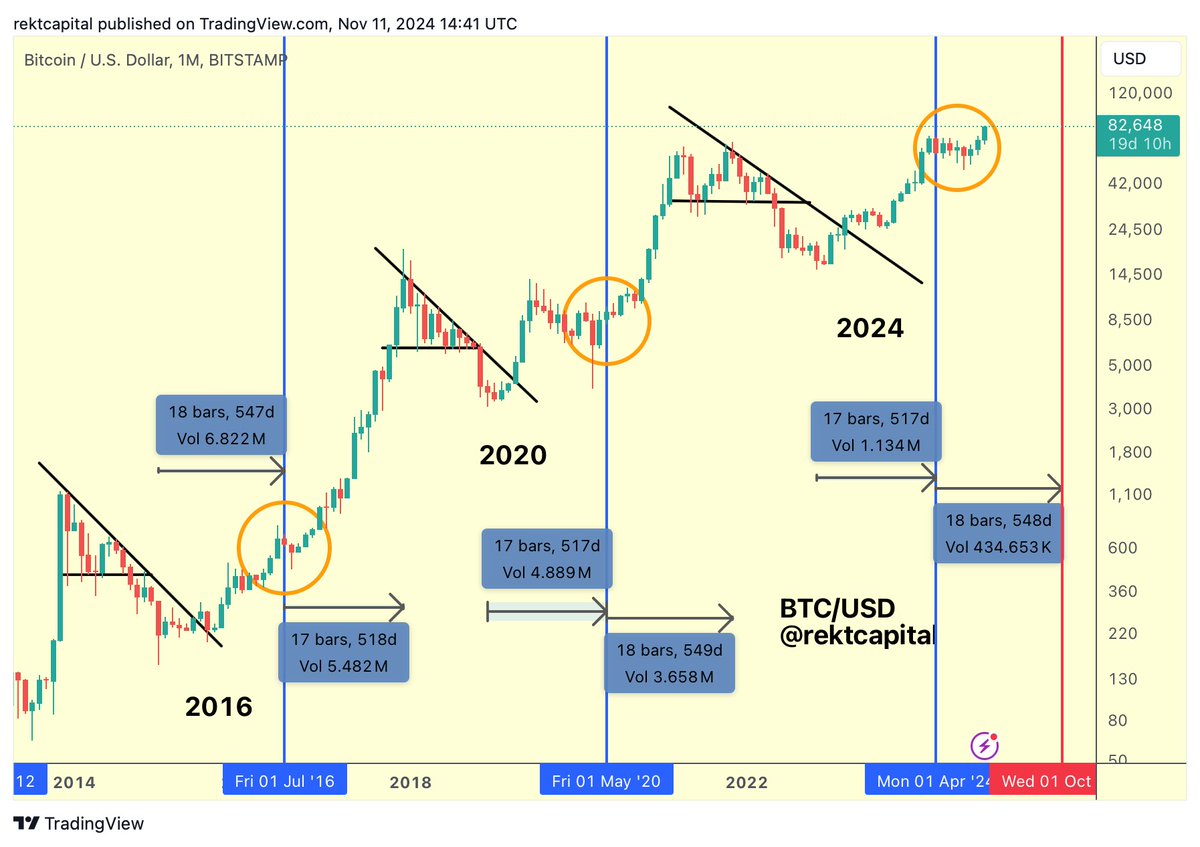
Bitcoin bottomed 547 days prior to the 2016 Halving but topped in its Bull Market 518 days after the 2016 Halving
Bitcoin bottomed 517 days prior to the 2020 Halving but topped in its Bull Market 549 days after the 2020 Halving
Bitcoin bottomed 517 days before the 2024 Halving but may very well top in its Bull Market ~549 days after the 2024 Halving
That's October 2025
History suggests two takeaways:
1. The Halving acts like a mirror. Bitcoin Bear Market Bottoms occur a similar amount of days prior to the Halving compared to the amount of days its takes for Bitcoin to form Bull Market Tops after the Halving
2. The best of the Bitcoin Bull Market is yet to come
$BTC #Crypto #Bitcoin
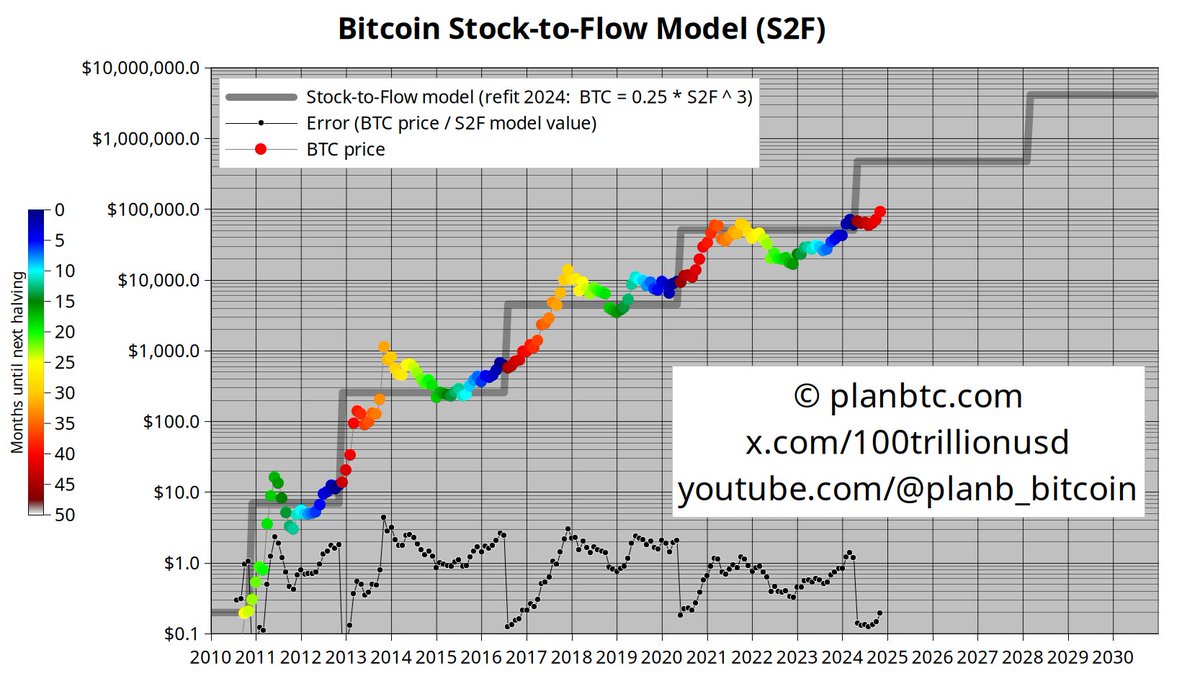
@100trillionUSD Your stock-to-flow model is spot on and super simple: buy 6 months before the halving and sell within 18 months after.
In the months ahead, we'll build wealth that lasts for generations.
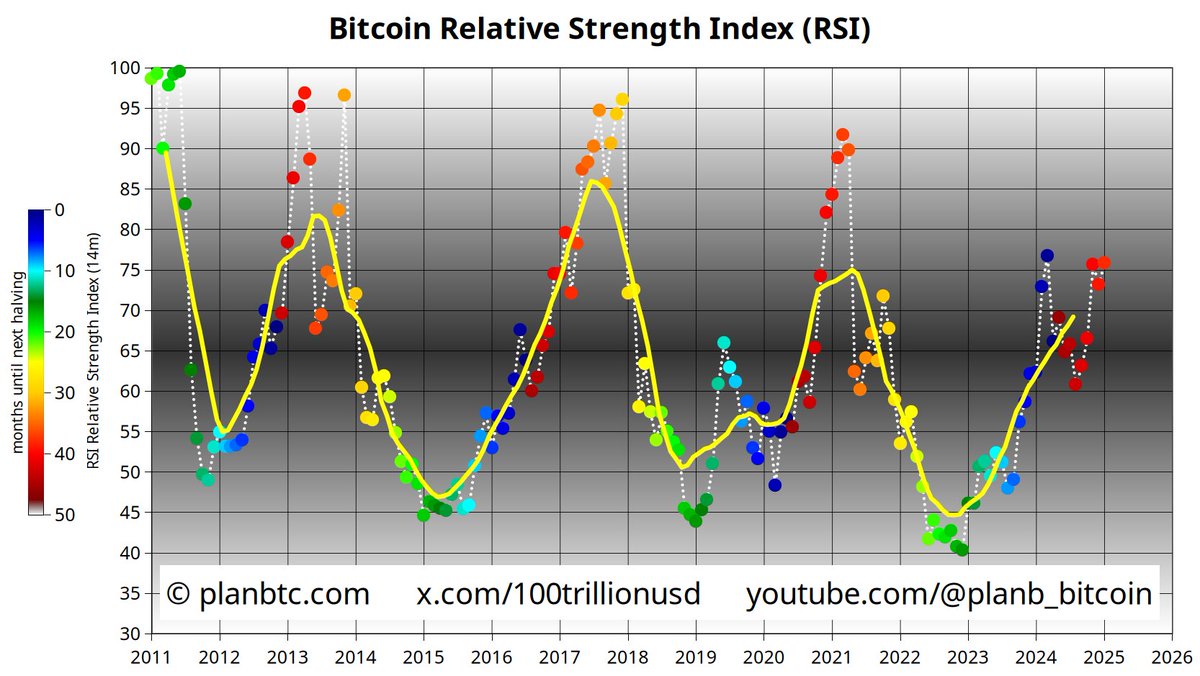
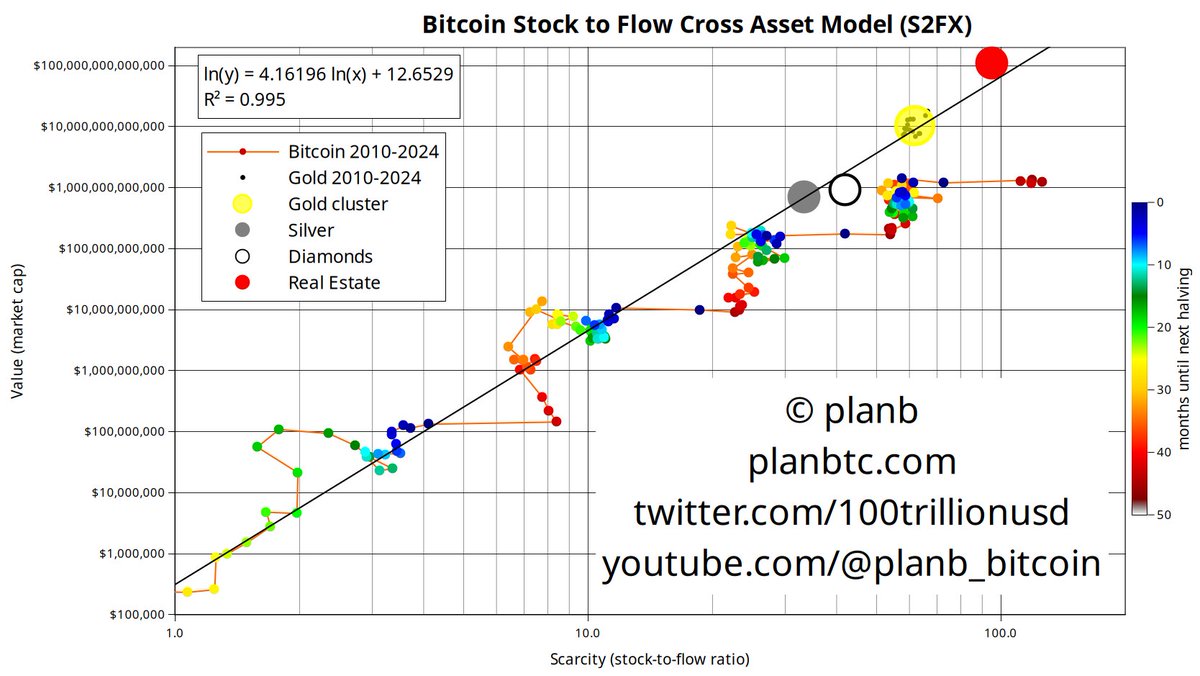
2024-2028 bitcoin halving cluster is forming:
- Starts with S2F jump after the halving (blue->red)
- Note: btc now scarcer than gold & real estate
- Then red dots turn orange/yellow at the top
- Note: btc jumps an order of magnitude
- Then a bear market (green) & recovery (blue)
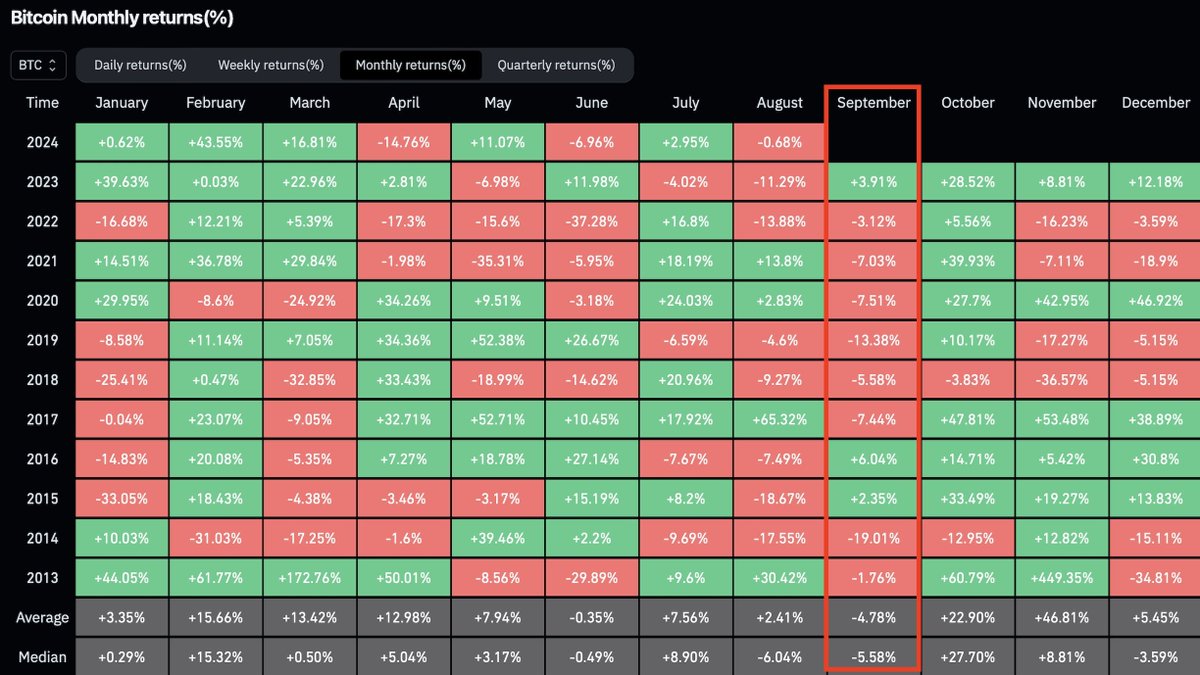
It is almost September.
Historically, it has been a terrible month for #Bitcoin...
Throughout history, Bitcoin closed September with a green candle only 3 times.
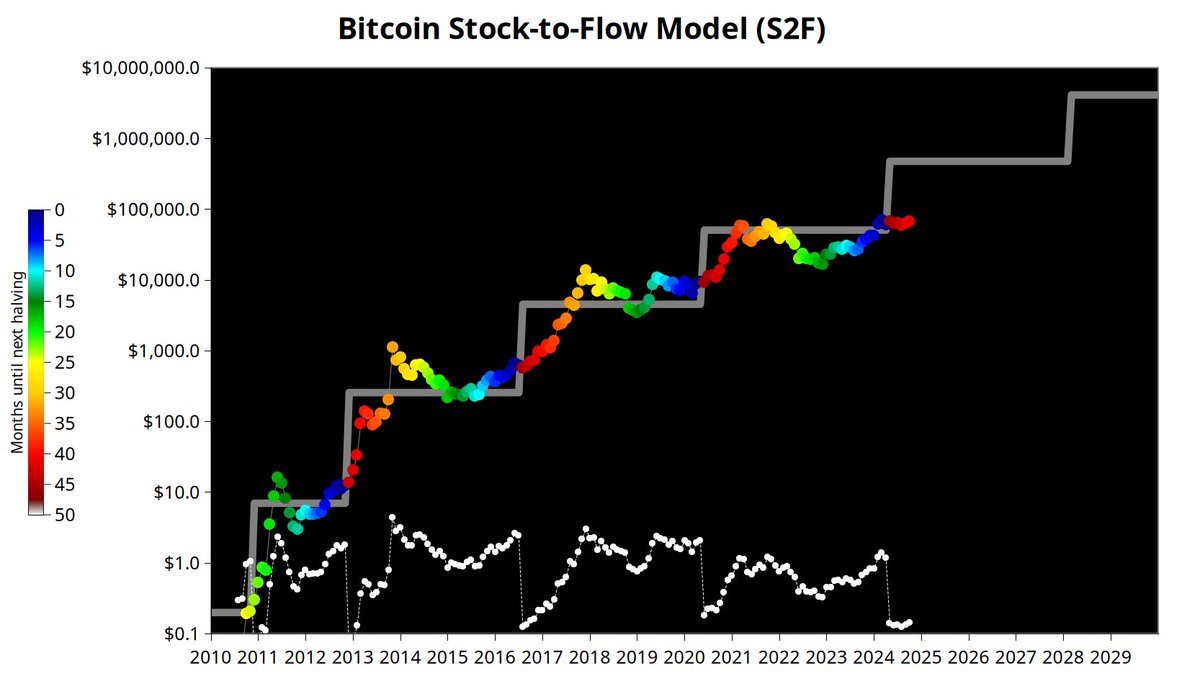
I was a traditional institutional investor before I became a bitcoiner. I noticed most traditional institutional investors (including myself) go through 3 bitoin stages:
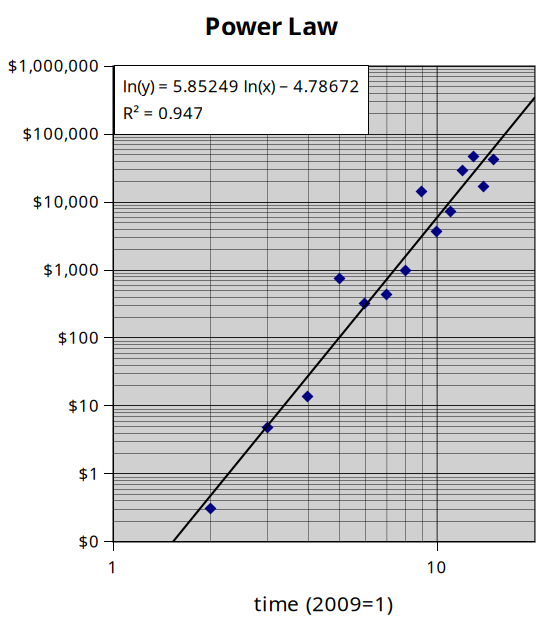
Stage 1) You are in awe about the almost exponential growth from below $1 to $60,000 in 13 years. You can only see it and understand it when you look with logarithmic scale. 5 orders of magnitude in 13 years means this is a real phenomena! Note that most people never reach stage 1 because they only see a bubble or pyramid scheme (these people are the linear thinkers).
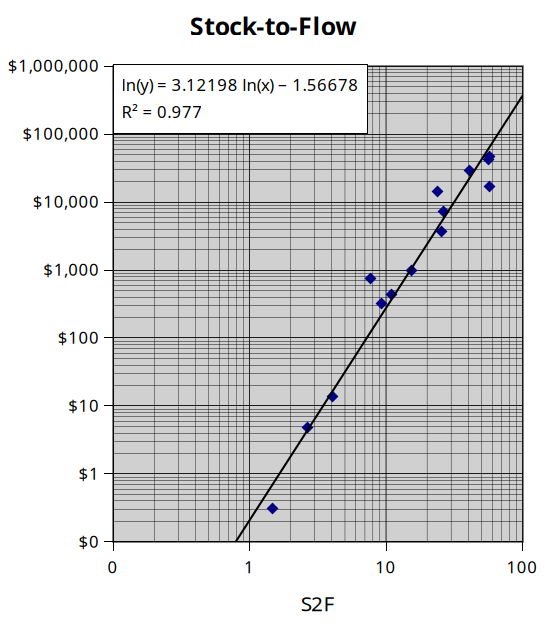
Stage 2) When you start fitting curves through the data (exponential, logarithmic, power etc) and applying stats (with R2, st.devs t-stats and prediction bands), the stunning regularity hits you even more. Adoption, laws of nature, whatever, this pattern is indeed non-random and somewhat predictable!
Stage 3) After 5+ years in bitcoin you start seeing deeper patterns: bitcoin has its own time (10min blocks) and its own cycle (4y halving cycle). It is fascinating that ALL bitcoin price gain is made in the 2 years around halvings and that the 2 years between halvings are net negative. This is what stock-to-flow (S2F) attempts to model, very simply (with just 1 variable) and very roughly (wide prediction bands). S2F model R2 is actually higher (97.7%) than a typical stage 2 model (94.7%). However, with only 4 halvings (2012, 2016, 2020, 2024), this pattern could still be spurious/random. Very interesting times ahead!
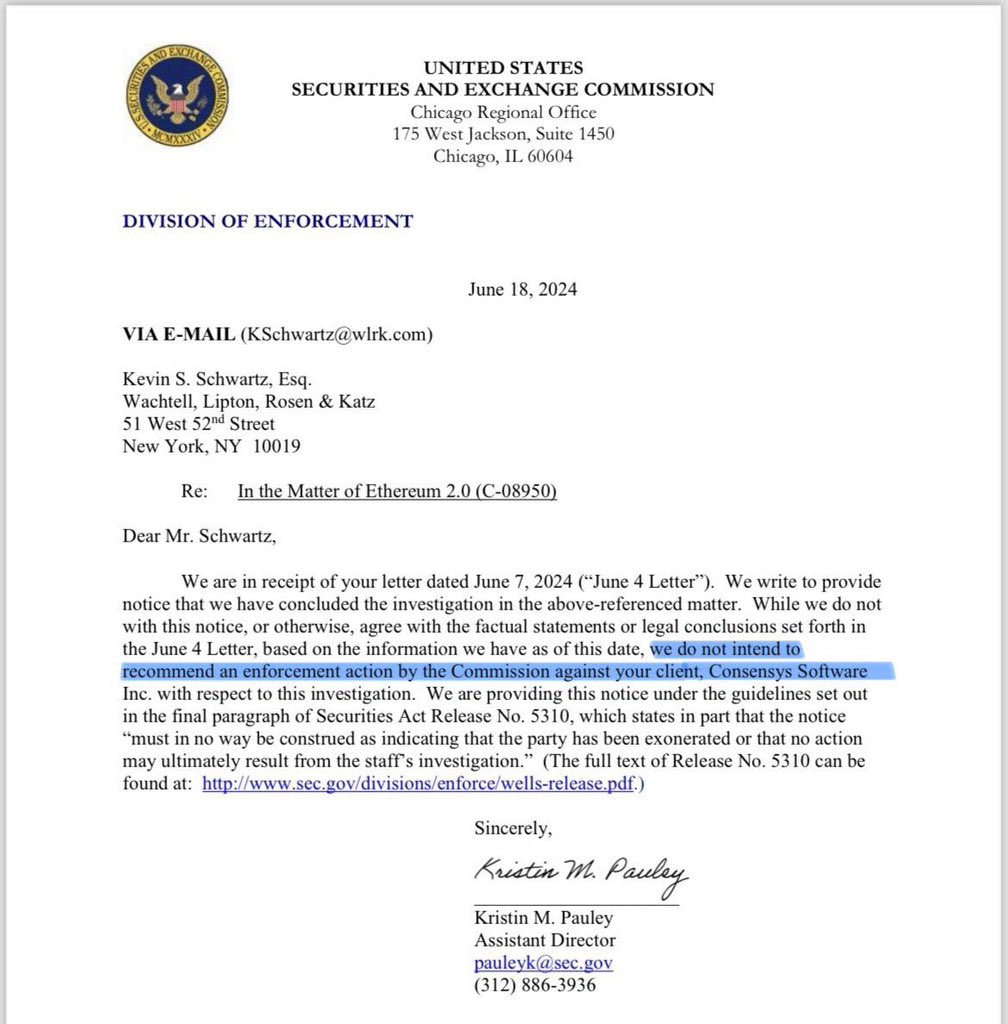
🚨 BIG BREAKING 🚨
🇺🇸 U.S. SEC HAS PERMANENTLY
SUSPENDED ITS INVESTIGATION
INTO ETHEREUM.
ETH ETF trading will start within next
3 weeks.
This will be the beginning of the biggest crypto Altseason.
Here's how you could make millions from it:
(Bookmark it)
1) Find high beta ETH play
With the ETH ETF going live, Ethereum ecosystem tokens will pump, but not every token will pump the same.
Look at the charts from January and March to find those tokens that pumped big when ETH rallied.
Accumulate more of those tokens, as they'll go parabolic.
2) Don't diversify much
Diversification is a good thing, but not for those who have a $5,000–$10,000 portfolio.
Find 5-7 good tokens and go big into it.
There are still 50x-100x tokens out there, so do some research and go accumulate.
3) Dump dino coins
This is one of the biggest mistakes most investors make.
Buying those tokens that have no updated tech, insiders are dumping, and bad tokenomics is just willing to be poor.
4) Study Altseason History
Altcoin MCap has always peaked 546 days after halving.
If history repeats itself again, altcoins will peak in October 2025, so make an exit strategy too.
If you find this helpful, like, repost, and bookmark it for the future.