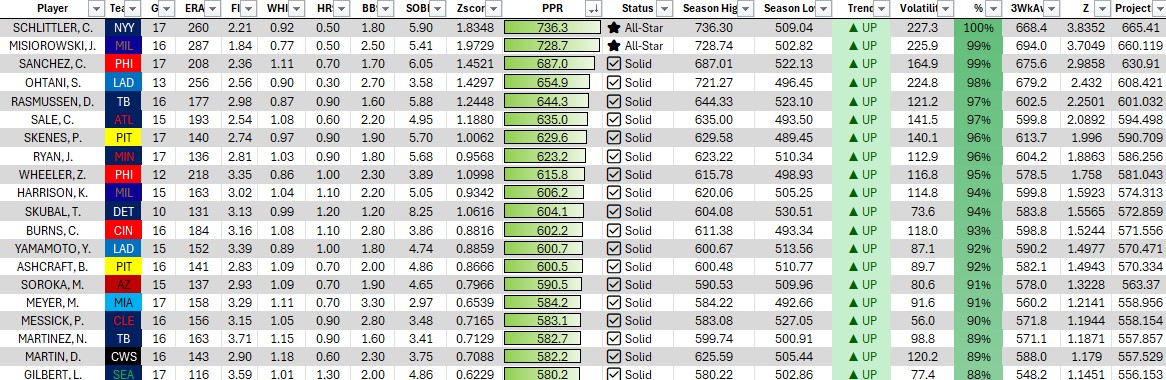
Cam Schlittler continues to dominate in most statistical categories 1.5 months into the season, but a perhaps surprising Davis Martin moves into the third spot. Notable is Paul Skenes, who was last in the majors after week one. He has dominated since a disastrous first start.
I will be keeping a close eye on how the metric handles Ohtani's stats as he continues to slip behind the control group in terms of overall innings. Theoretically, once the starters hit 10 starts, the stabilizer should kick in to penalize small sample sizes.
About thirty games into the season, and Jose Soriano has finally returned to Earth. The next obstacle the metric faces is Shohei Ohtani's dominance through a comparatively small sample size.
Also, check out Paul Skenes already back in the top 10, after being last in the entire league after a disastrous first start. Dominance since has moved him swiftly up the rankings, as his numbers have mostly recovered.
Roughly a month into the season, Jose Soriano remains so dominant that my metric is not quite performing to what I have hoped. His ERA+ figure is so high that, as one would expect in a normal distribution, the rest of the league looks pedestrian in comparison.
If you look below Soriano, the data set is remarkably clustered around the 480-520 score mark, which I would anticipate to start rising soon. As pitchers reach their ninth start, the modifier I use to balance sample size moves from a 10 to a 7.
Once you look beyond the top two pitchers, there is a large gap and an extremely clustered 3-20, and this crowding continues all the way down, which is to be expected in a normally distributed data set. Here is the current plot for every starter in the MLB this year.
After three weeks and another strong outing from Jose Soriano, his inflated ERA+ continues to pull him well ahead of the rest of the league. At this point in the season, it only takes one bad start to "normalize" stats like ERA+, so I would guess the leaders will be close soon.
Now about two weeks into the year, and the metric is starting to come alive a bit. Most ERA+ numbers are falling back to Earth, except for Jose Soriano's flaming hot start to the year - he has gone 27.0 innings in four starts, only allowing 1 ER.
If you take away Soriano's inflated ERA+ and Cam Schlittler's inflated SO/BB ratio (he has only given up one walk all year), the top of the rankings is very clustered.
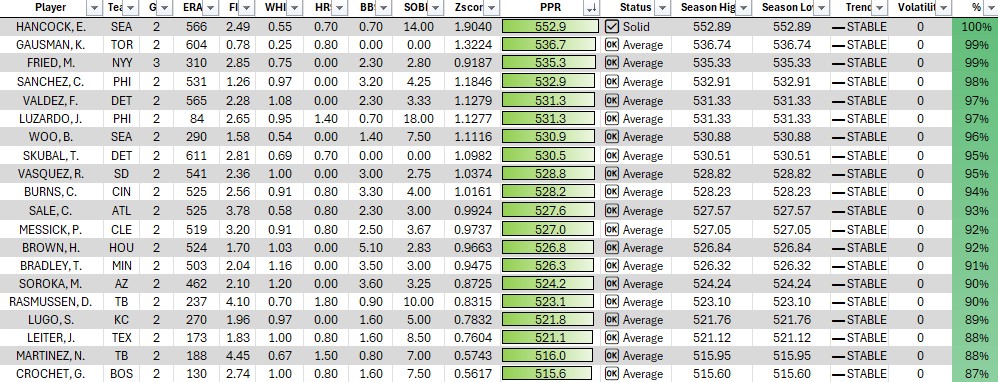
5. Volatility will come alive next week when more data is added, and pitchers can be compared week-over-week. Additionally, a moving 3 week average and projection column will be added in May.
After about a week and a half of play, I feel like we have a sample size large enough to provide at least a somewhat accurate starting pitcher ranking, using my new metric design. Emerson Hancock's eye-popping strikeout numbers move him into first place at the first of 26 weeks.
4. Season high and season low are the same right now, because I grab a snapshot of the data after Sunday games each week. Since this is week one of my snapshots, there is nothing to compare to. This is also why every pitcher shows "Stable".