Ethereum looks vulnerable here.
The rebound appears corrective and support is under pressure. A breakdown could accelerate selling toward the lower trendline target.
📉 Bearish below recent highs.
⚠️ Support break = likely downside continuation.
#Ethereum#ETH#Crypto #ElliottWave #TechnicalAnalysis
New YouTube video premiering shortly at 11.45 p.m
NIFTY appears to be completing a WXY correction with the Y wave taking the shape of a possible ABCDE triangle. The correction has retraced nearly 61.8% of the previous advance.
Interestingly, Infosys and TCS have made fresh lows, but NIFTY IT has not confirmed those lows, creating a positive divergence.
Could a bounce be near?
Watch the complete Elliott Wave analysis here:
https://t.co/UXIuCn9fPv
#Nifty #Nifty50 #NiftyIT #Infosys #TCS #ElliottWave #StockMarket #Trading
My Gold analysis few days back
GOLD Weekly Analysis
Gold weekly structure suggests the major uptrend started from the extreme low of December 2015. The red-colored Wave 1 appears to have completed around July 2020, followed by a prolonged Wave 2 correction.
By February 2026, the red-colored Wave 3 seems completed, and now Wave 4 correction is in progress. The key question is whether a sharp bounce can happen immediately.
Wave 2, from Aug 2020 to Oct 2022, was a flat correction that consumed more than 800 days. Because of alternation, Wave 4 may unfold faster in terms of time, but the probability of a deeper price correction still remains high.
So far, only the 23.6% retracement has been tested. That suggests downside pressure may not be over yet, and the probability of a decline toward the 38.2% retracement zone remains open before any meaningful bullish reversal develops.
#Gold #XAUUSD #ElliottWave #GoldAnalysis #TradingView #TechnicalAnalysis
BITCOIN ANALYSIS.
In this weekly Bitcoin Elliott Wave analysis, I examine the entire bullish cycle from the left-hand-side low and discuss why the larger uptrend appears to have completed a five-wave impulsive structure.
Key observations:
🔹 Waves 1 and 3 are nearly equal in length, suggesting that Wave 5 became the extended wave of the sequence.
🔹 The final advance developed into an Ending Diagonal, a pattern often seen near major market tops.
🔹 After completing the five-wave advance, Bitcoin has entered a corrective ABC structure.
🔹 Wave C of the correction is currently in progress.
🔹 Within Wave C, Waves 1 and 3 appear approximately equal. According to Elliott Wave guidelines, this raises the possibility that Wave 5 of C could extend before the correction finally concludes.
🔹 The black rectangle on the chart marks the territory of the previous fourth wave of one lesser degree. Markets frequently retrace back to this region following the completion of a five-wave impulse.
🔹 Therefore, Bitcoin may find support within this zone or slightly below it before the larger correction is complete.
This decline should be viewed as a normal correction following a powerful five-wave bull market rather than a sign of long-term structural weakness.
⚠️ The correction may not be over yet, and traders should remain patient while monitoring price action near the highlighted support area.
Disclaimer
This analysis is for educational purposes only and should not be considered financial advice. Always conduct your own research and manage risk appropriately.
#Bitcoin #BTC #BitcoinAnalysis #ElliottWave #CryptoAnalysis #BTCUSD #Cryptocurrency #TradingView #TechnicalAnalysis #CryptoMarket #BitcoinCorrection #WaveAnalysis #BitcoinPricePrediction #CryptoTrading #BTCAnalysis
Ethereum narrowly missed the projected target and bounced strongly from the 1.618 Fibonacci extension level. Price is now trading above the 20-period moving average, signaling improving short-term momentum. Watching closely for either a final push higher or the start of a corrective move. This is hourly chart.
#Ethereum #ETH #Crypto #ElliottWave #TechnicalAnalysis #ETHUSD #CryptoTrading #TradingView
🎯 Ethereum is now approaching the final target zone, with nearly 95% of the projected target already achieved.The price is just a touch away from completing the expected Elliott Wave objective. Traders should remain alert for signs of exhaustion or a reversal near the target area.📈 Target almost achieved.
👀 Waiting for the final touch.
⚠️ Watch price action carefully near resistance.#Ethereum #ETH #Crypto #CryptoTrading #ElliottWave #TechnicalAnalysis #ETHUSD #Bitcoin #Altcoins #TradingView #CryptoMarket #Investing #WaveAnalysis #Blockchain #CryptoNews
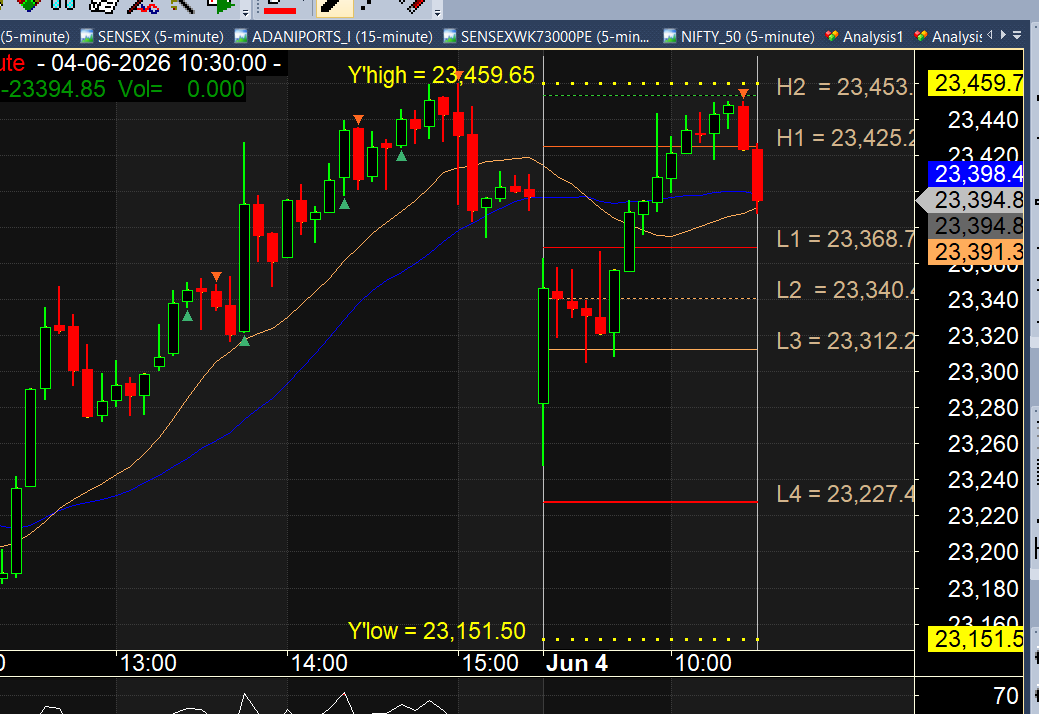
Nifty continues to hold above the rising trendline and key Fibonacci support zone. The recent dip was quickly bought, indicating underlying strength.A sustained move above 23,475-23,500 could open the door for a rally towards 23,550+ and higher levels.⚠️ Stop-loss for bullish view: Below 23,345Trade with proper risk management.#Nifty #Nifty50 #NSE #StockMarket #Trading #ElliottWave #TechnicalAnalysis #IndianStockMarket #PriceAction #MarketOutlookShorter version:🚀 Nifty likely preparing for the next leg up.Price has respected the rising trendline and bounced from the Fibonacci support zone. A decisive move above 23,475-23,500 may trigger fresh upside momentum.⚠️ Stop-loss: Below 23,345#Nifty #Nifty50 #ElliottWave #TechnicalAnalysis #NSE #Trading #IndianMarkets 📊
SENSEX Weekly Expiry
Wave 1 and Wave 2 of C wave appear to be complete. Trade carefully.
If this Elliott Wave count is correct, an aggressive 3rd wave of C may be starting. First observe the opening. If there is a gap down, watch whether the gap gets filled or not. In strong 3rd waves, gaps are often not filled quickly.
Stop Loss: 74,853
Educational view only. Risk management is essential.
#Sensex #SensexExpiry #WeeklyExpiry #ElliottWave #WaveAnalysis #TechnicalAnalysis #StockMarketIndia #TradingView #PriceAction #MarketAnalysis