Most People Use Liquidation Maps Wrong. Stop It.
They treat a single model and timeframe as gospel, as if the brightest yellow line means price is guaranteed to go there next.
That is not what a liquidation map is.
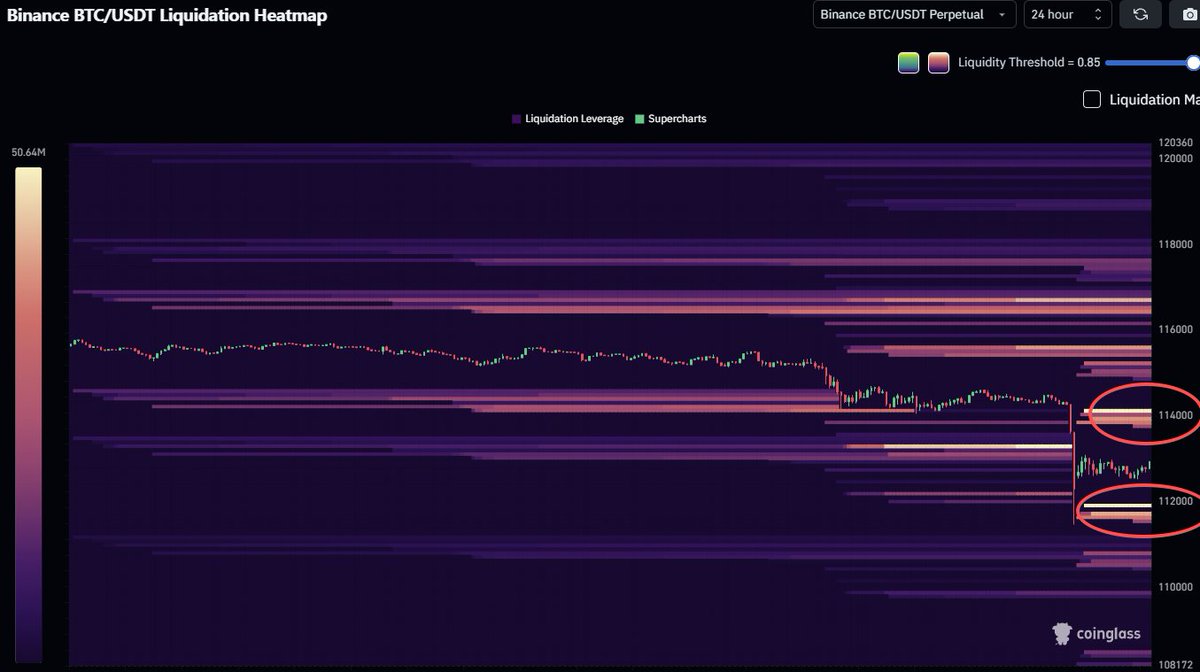
A liquidation map is an algorithmic estimate of where liquidations may be clustered based on price, leverage, open interest, and model assumptions. It is not a crystal ball. It is not based on a live aggregate of actual liquidation price of actual open trades.
It is simply one data point.
An important one - but still only one.
As with most of trading, the real alpha comes from confluence.
For example, if I am trying to understand where BTC may move over the next couple of days, I am not just opening one heatmap and calling it a day.
I want to see Model 1 on the 12 hour chart to understand the immediate high-leverage battlefield.
Then I want Model 1 on the 24 hour chart because that is usually the cleanest short-term anchor.
Then I want Model 1 on the 3 day chart to see whether the same levels are still meaningful on a slightly longer time horizon.
Then I want Model 2 on the 3 day chart to check whether the broader liquidation structure agrees with what Model 1 is showing.
If multiple models and timeframes keep pointing toward the same BTC zone, now we may have something.
Still not a guarantee. Confluence.
Confluence is a traders friend.
A bright liquidation band by itself can be noise. A bright liquidation band that lines up across models, timeframes, market structure, open interest, funding, order book behavior, and price action becomes a much stronger signal.
And yes, this is the annoying part:
Even after doing all of that work, it is still not a guarantee of price direction.
BTC can still ignore the obvious level. It can sweep the opposite side first. It can bait everyone into the obvious trade and then reverse violently because the obvious trade often serves as bait.
But that is the entire point.
The work is not about finding certainty.
The work is about filtering signal from noise.
If you struggle visually finding confluence across several different visual maps, this is one area where an AI companion can actually be useful.
Not to blindly tell you what to trade, that would be dumb.
To help you crunch multiple screenshots, compare models, identify overlapping zones, and ask better questions.
A simple prompt could be:
“I am using BTC liquidation heatmaps to analyze short-term price movement over the next 0-3 days. Compare these screenshots across models and timeframes. Identify the major liquidation zones above and below current price, tell me which zones have the strongest confluence, explain whether the setup favors an upside sweep, downside sweep, or trap on both sides, and make clear what would invalidate the assumption”
Why am I suggesting to use AI to analyze images even though I know some people will mock it? Because AI can spot things with a higher accuracy and speed than our minds can. Remember the old game "Where's Waldo?" Who do you think win's the race to accurately find Waldo amongst a bunch of noise between a human or a machine?
Liquidation maps are useful when you stop thinking about them as prophecy and start thinking about them like a map of potential pain.
Ask better questions and you'll typically learn better answers.
Instead of asking "where does the heatmap say price is going next?" ask "Where is the nearest vulnerable leverage? Which side would create more forced buying or forced selling? Do multiple models and timeframes agree? Does price action confirm the idea or reject it?"
That is how you use liquidation maps like a trader instead of chasing glowing lines like a moth to the flame.
🫡 From the depths —
The White Whale 🐋
The worst performing Top 200 coins of 2025:
1- $TIA $7 → $0.5
2- $BEAM $0.03 → $0.003
3- $JITO $3.7 → $0.35
4- $EIGEN $5 → $0.4
5- $BRETT $0.17 → $0.015
6- $DYDX $2.2 → $0.18
7- $W $0.35 → $0.03
8- $RUNE $6.4 → $0.6
9- $CORE $1.3 → $0.14
10- $THETA $2.7 → $0.32
If you had invested $1,000 in these coins at start of 2025, their value would be around $100 now ...
JUST IN: Anti-CZ Hyperliquid whale who increased his $ASTER short positions after CZ’s buy post is now sitting on $19.87 million in unrealized profits across two wallets.
0x9eec98D048D06D9CD75318FFfA3f3960e081daAb
0xbadbb1de95b5f333623ebece7026932fa5039ee6
⚠️Announcement:
We’ve received user feedback and found that some tokens launched on the BSC FLAP launchpad may carry contract risks. Certain tokens are configured with dynamic tax rates, which can lead to a 100% sell tax, making them unsellable in some cases.
For users who haven’t manually set any filters, FLAP has been removed from the default trenches filter.
We also remind all traders of meme tokens launched via FLAP to be cautious and aware of potential trading risks.
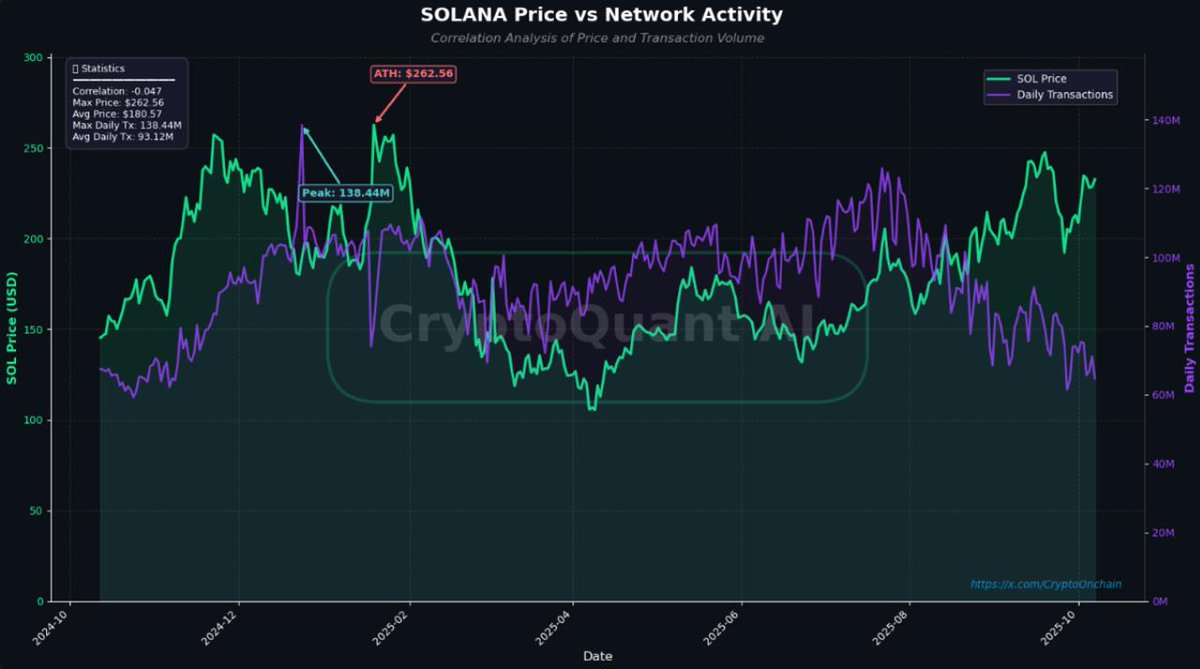
🚨SOLANA ACTIVITY DROPS SHARPLY!
Despite $SOL price rally, daily transactions have fallen nearly 50%, from 125M in July to 64M now, according to CryptoQuant.
here’s why @cz_binance new launchpad is actually super bullish for memecoins 🗒️
- non transferrable pre migration: = no bundles, NO insider trading
- KYC: no scammer is going to sign up to try and do scams and give their entire info up
- 1M bonding: makes it essentially impossible for scammers to execute a profitable scheme effectively
they really thought through all the issues on this ecosystem and once this catches on it will ignite the biggest memecoin super cycle in history
now the only way scams will be executed are through highly organized teams which we are going to filter, showcasing the organic projects
the days of scammers rugging every other 10K MC coin for $5 are over
Airdrop points system posted on @MetaMask GitHub
Details of the point calculation system have been added on MetaMask GitHub.
Points are given based on spot and futures trading volume on MetaMask, as well as bonus points for past activity.
MetaMask Point Calculation
- Spot trading: 80 points per $100
- Futures trading: 10 points per $100
- Past trading: 250 points per $1,250 (up to 50,000 points)
- Using the LINEA chain: 100% bonus points
The OpenSea and MetaMask TGEs are approaching
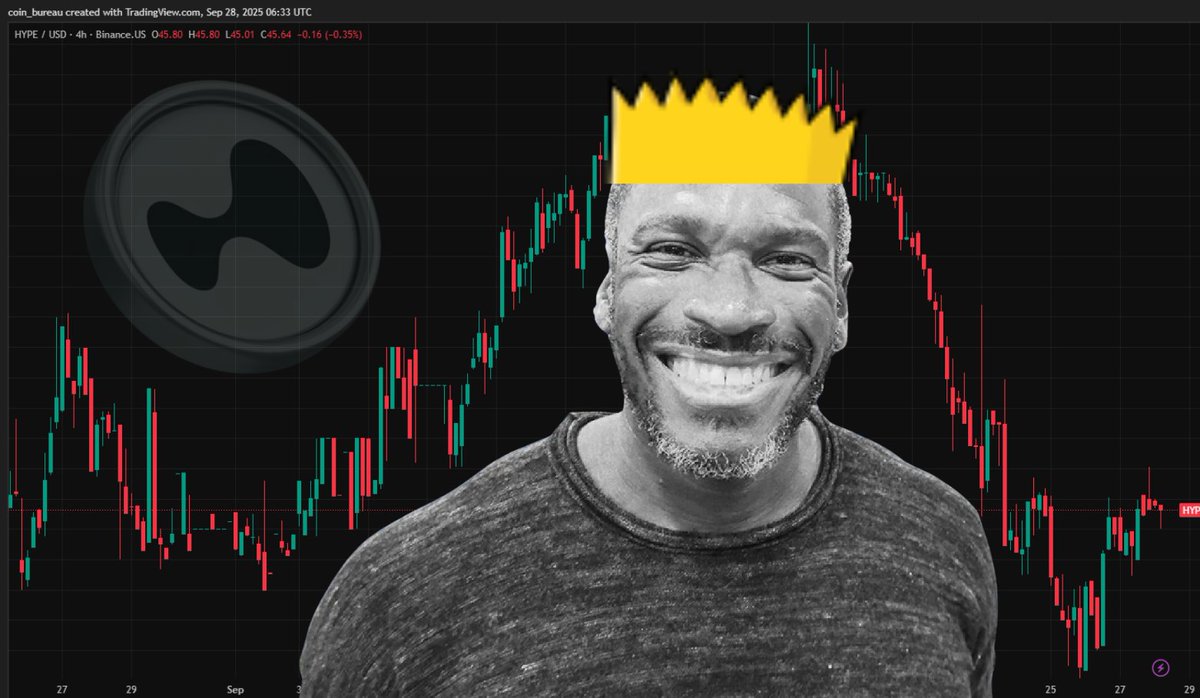
🚨BREAKING: Hyperliquid proposed to BLACKLIST Arthur Hayes from buying $HYPE.
Community says his trades are the ultimate sell signal, warning #HYPE chart could turn into a Bart Simpson haircut.
Aster is about to give away +$800M on October 5th for their airdrop.
But most people will get nothing by farming it wrongly.
I studied it for the past 6 hours.
Here is how to properly do it: 🧵
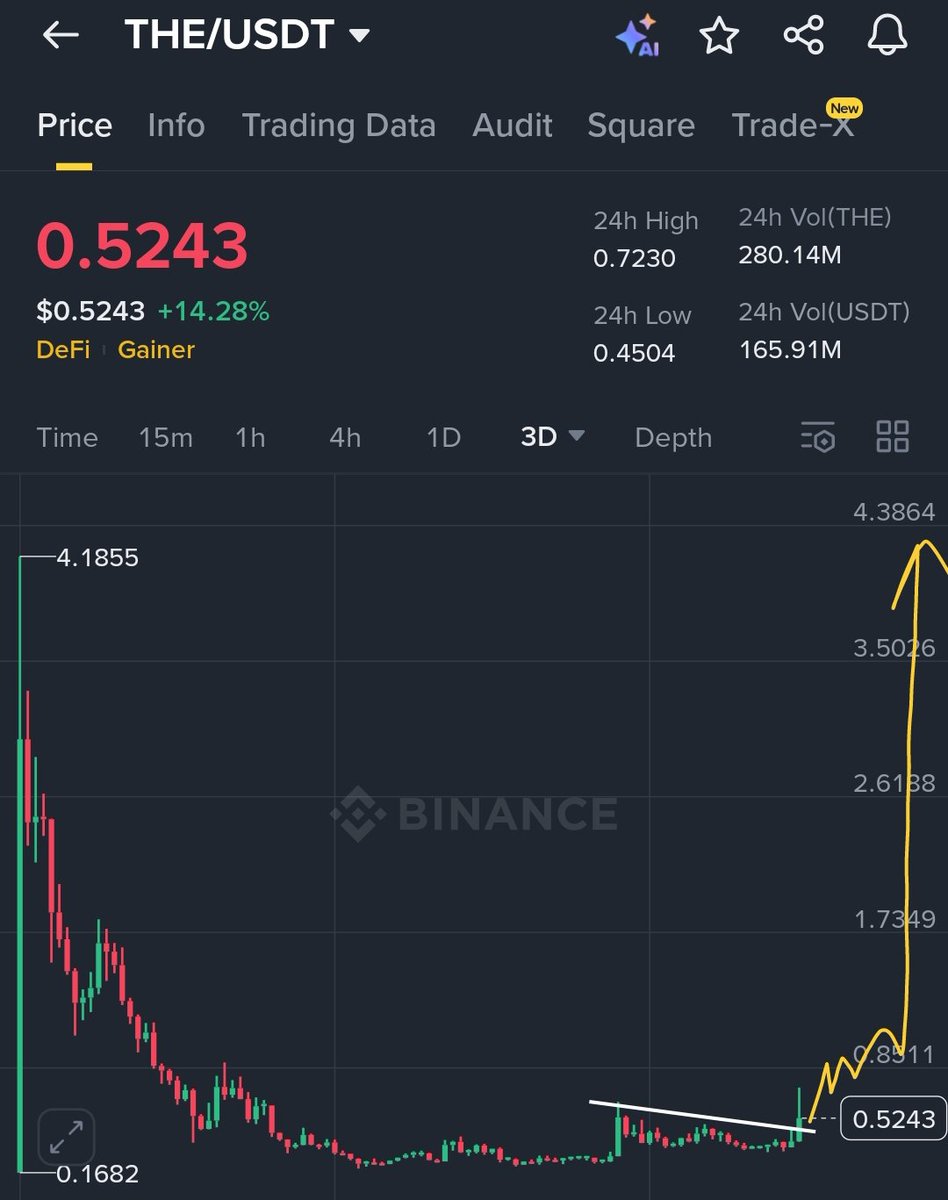
$THE @ThenaFi_ pulled back for a clean retest of its breakout zone nothing unusual, just healthy pa before the next leg up.
For the first time in 220 days, it’s finally broken out of consolidation and this dip could be the best entry to scale in.
It’s still deeply undervalued, sitting at rock-bottom levels. Compared to its competitors, the market cap is tiny.
To match $ASTER ($2.4B): 40x
To match Hyperliquid ($14B): 200x
The upside here is insane. 🚀
Backed by #BinanceLabs, and CZ has also commented on it 👀