2/
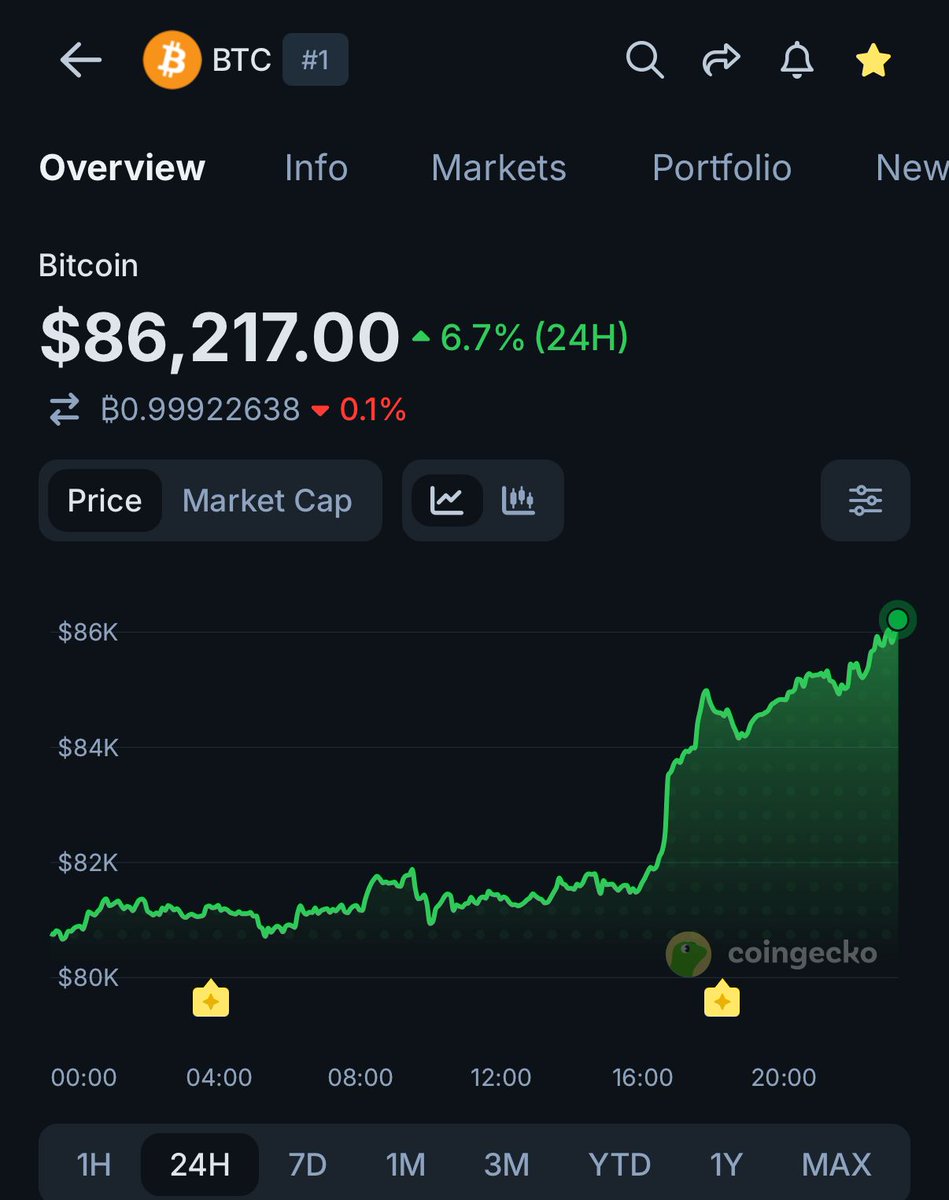
When the world moved, TradFi was offline. DeFi was live.
24/7 isn't a feature anymore. It's the standard.
$4.7B is small relative to global equities. But it's the start of the pipe.
The pipe only gets bigger from here.
Traders who can access markets whenever they move — regardless of what traditional exchanges are doing — have an asymmetric edge.
That's the whole point of trading onchain.
Markets don't sleep. Neither should your access.
Trade 24/7 on MUX 👇
100x leverage | 0 price impact on BTC & ETH
https://t.co/qtpX9OQWVI
Onchain tokenized equity supply just went vertical. 🚀
The data:
📊 +$932M added last week — BIGGEST weekly jump on record
📊 Total supply now above $4.7B — all-time high
📊 Record volumes during midterm election volatility
The reason is simple:
When traditional markets closed during midterms, onchain markets kept trading.
When volatility hit over the weekend, onchain markets kept pricing.
3/
What happens next:
→ Midterms next week + political uncertainty amplifying
→ Leveraged positioning unwinding violently
→ No clean monetary rescue available (Fed trapped)
→ Hard money assets catching the escape bid
→ Volatility structural, not transient
This isn't the time to pick a side.
It's the time to be positioned for both.
The traders who stayed nimble this week are printing. The ones who were only long are hurting.
Trade both sides. Trade smart 👇
100x leverage | 0 price impact on BTC & ETH
https://t.co/qtpX9OQWVI
The Nasdaq 100 is down nearly -5% today. 🔴
And the setup underneath is loaded.
What's happening in parallel:
🔴 Nasdaq 100: -5% on the day
📊 Democrat midterm sweep odds: 65% → 72% in 2 days (record high)
💰 Treasury yields: barely moving despite the equity carnage
🛢️ Oil: still $100+
📈 CPI, PPI, PCE: all rising
2/
Here's the part that matters most:
Stocks crashing + yields NOT falling = no safe haven bid.
In normal regimes, equity selloffs = Treasury bid. Risk off, rates down.
That's not happening today.
Translation: there's no escape valve inside traditional portfolios.
And remember what we flagged just 3 days ago:
$12B piling into leveraged long ETFs. $9B into SOXL alone. The largest 2-week leveraged inflow on record.
We said: "Up = 3x the rip. Down = 3x the pain."
Today, we're learning what the "down" side looks like.
3/
Leveraged positioning doesn't predict direction. It amplifies both.
Volatility is on tap 👇
100x leverage | 0 price impact on BTC & ETH
https://t.co/OMcTX6vNNi
Leverage is going vertical. 🔥
The data:
📊 Top 10 US leveraged equity ETFs: +$12B inflows (last month)
📊 Market cap of those same funds: -$20B over the same window
📊 $SOXL (3x semis): +$9B in 2 weeks — LARGEST 2-week inflow on record
📊 $TQQQ (3x Nasdaq 100): +$1.3B (2nd-largest 2-week intake of 2026)
📊 5-month total: +$19B
Read that stack again.
$12B went IN while market cap fell $20B.
Translation: investors are AGGRESSIVELY buying the dip with 3x leveraged products.
2/
This is conviction at maximum leverage.
It's also fuel.
Two paths from here:
🟢 Semis + Nasdaq rip → leveraged flows amplify the move. Buyers get 3x the upside. Shorts get steamrolled.
🔴 Semis + Nasdaq break → forced deleveraging cascade. 3x long means 3x the pain. Liquidations compound.
4/
Without the Iran War, this market is probably at 9,000+. With it, it's at record highs anyway.
Q2 2026 earnings grew +52% — highest since Q2 2021 when the government handed out $4T in stimulus.
This time? Organic. AI-driven. Real.
Market concentration isn't the risk. It's the setup.
Own the asymmetry 👇
100x leverage | 0% spread on BTC & ETH
https://t.co/qtpX9OQWVI
The S&P 500 is 2% from an all-time high.
And most of the S&P 500 is already in a bear market.
Both true. At the same time. 🔍
The hidden stats:
🔴 84% of S&P 500 stocks are down 10%+ from highs
🔴 59% are down 20%+
🔴 41% are down 30%+
🔴 17% are down 50%+
Leaderboard of pain:
→ Real Estate: 97% down 10%+
→ Materials: 96%
→ Utilities: 94%
→ Consumer Discretionary: 92%
3/
NVDA's stock is up +900% in 5 years. Its P/E ratio? Down -46% in the last 12 months. Forward P/E now ~24x — nearly in line with the S&P at 22x.
Large-cap tech is trading at discount multiples at record highs.
Translate it:
→ Earnings growth is outpacing price (unusual)
→ 490 stocks are already repriced for pain
→ If breadth widens even slightly → buying pressure explodes
→ If tech multiples re-rate to historical premium → massive upside
🚨 The reacceleration is official.
September CPI: 3.7% (vs 3.6% expected)
September Core CPI: 2.6% (vs 2.5% expected)
3rd highest reading in 2 years.
The inflation story most retail bought in July was simple: "CPI is cooling, Fed can cut, risk assets rip."
The inflation story the market has been pricing since August: "CPI stopped cooling. Yields exploded. Hard money flows surged. Something had to give."
Today's print validates the second story.
Follow the thread:
1⃣ ISM Services Prices Paid spiked (August) → leading indicator
2⃣ 10Y yield went vertical (September) → bond market pricing it
3⃣ Gold + crypto ETF inflows surged (September) → smart money rotating
4⃣ September CPI prints hot (October) → confirmation
The sequence is textbook. Leading indicators flashed. Yields moved. Flows followed. Data confirmed.
What's left to catch up: the crowd.
And when the crowd catches up to a trend that's already been running for 3 months, the moves get violent.
The reacceleration isn't the trade. The repricing is.
Be positioned before the next CPI print 👇
https://t.co/qtpX9OQWVI
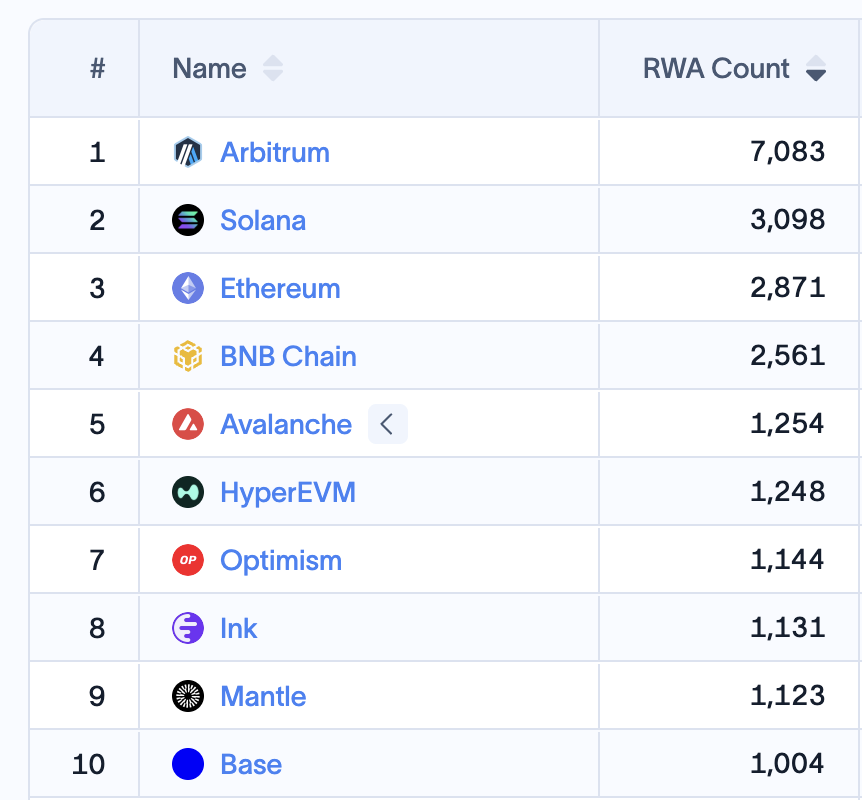
$USDG from @Paxos is now live on Arbitrum.
Joining the Global Dollar Network brings Arbitrum closer to GDN members like @RobinhoodApp, @krakenfx, @OKX and more.
We'll grow $USDG as a core asset on Arbitrum One through partner incentives and protocol-level integrations. 🧵
2/
When bonds sell off THIS fast, hard assets win. Gold and crypto inflows already at 10-month highs — that wasn't luck. That was front-running the break.
Cash holders are getting run over in slow motion.
Be positioned for the resolution 👇
https://t.co/OMcTX6vNNi
The 10Y just hit 5.30%. 🚨
Highest since April 2002. Twenty-four years.
+55bps this month. +138bps since the March low.
Mortgage rates nearing 7.60%.
The escalation ladder in MUX's feed:
4.47% → 4.55% → 4.63% → 5.13% → 5.30%.
Every post said the same thing. Something breaks.
The pace is accelerating. The Fed is out of moves.
2/
This is no longer a months-or-years problem.
Straight-line yield spikes only end one of two ways:
→ Emergency Fed intervention
→ Something breaks in the system
Both are violent. Neither is priced in.
This is unsustainable. And the market is about to tell us how.
Be positioned for the break 👇
100x leverage | 0 price impact on BTC & ETH
https://t.co/qtpX9OQWVI
The 10Y just hit 5.13%. 🚨
Moving in a LITERAL straight line higher.
Here's what 5.13% actually means:
🔴 Mortgage rates: heading well above 7%
🔴 US government interest expense: exploding
🔴 Corporate refi wall: crushing
🔴 Duration trades: annihilated
🔴 Fed credibility: gone