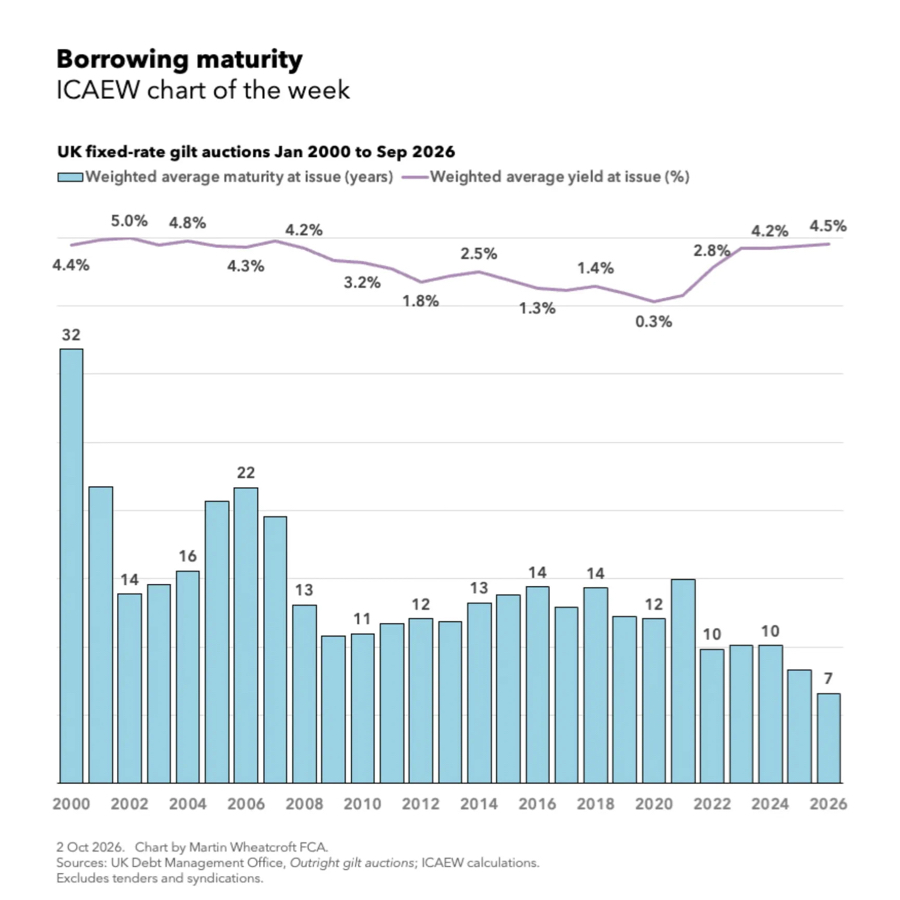
My #icaewchartoftheweek for @ICAEW shows how the @UK_DMO of @hmtreasury is borrowing for far shorter periods so we're not paying 6% on 30-year gilts. But we are more dependent on the 'kindness of strangers' by refinancing more often.
Read more: https://t.co/2Edj1n3JIx
My #icaewchartoftheweek for @ICAEW is on the 6.2m people who work in the public sector in the UK, 18% of the total workforce. One third work for the NHS, while 9% work for the Civil Service.
Read more: https://t.co/q8j8uIiKzN
My #icaewchartoftheweek for @ICAEW shows how the 62m people who live in England & Wales are distributed by @ONS statistical region, but with the Greater Manchester and West Midlands city-regions shown separately.
Read more: https://t.co/UwzMUnr9NP
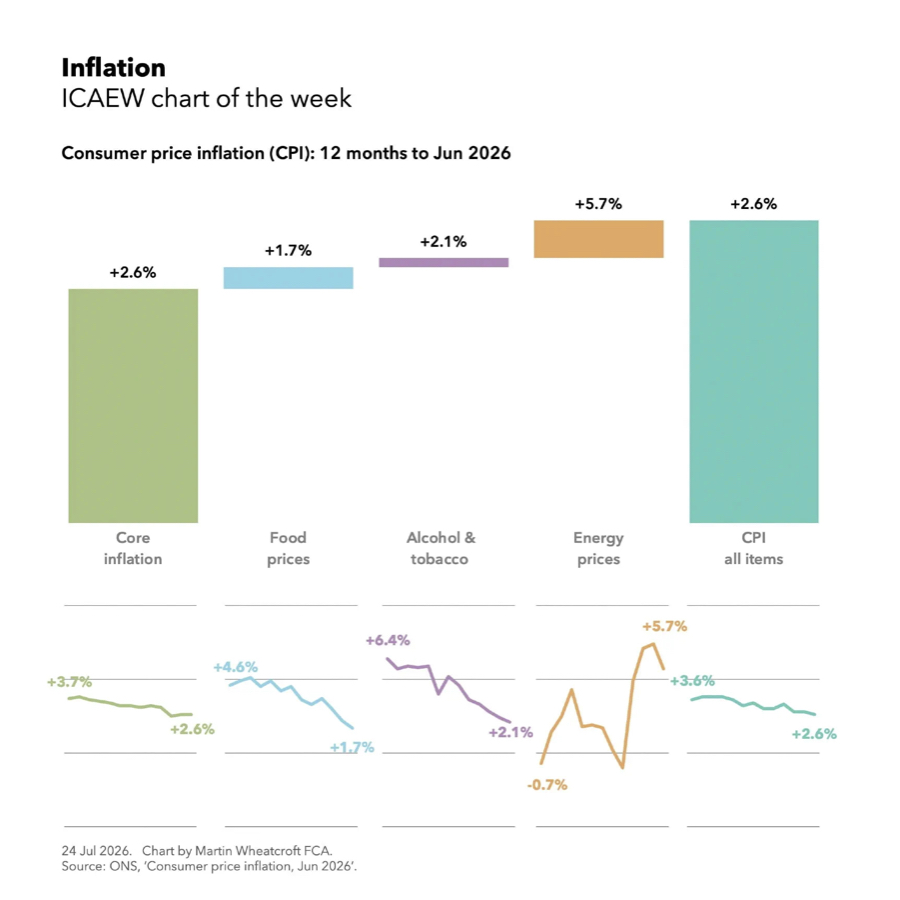
My #icaewchartoftheweek for @ICAEW shows how #coreinflation and food, alcohol & tobacco, and energy prices rises of 2.6%, 1.7%, 2.1% and 5.7% made up #cpi of 2.6%.
Read more, including comments from ICAEW Chief Economist @Suren_Thiru: https://t.co/lnwVEwBvnH
Successive governments have failed to address the implications of many more people living longer not always healthier lives. Let's hope this one starts to take the need for a long-term fiscal strategy more seriously.
Read more: https://t.co/Utak50el7D
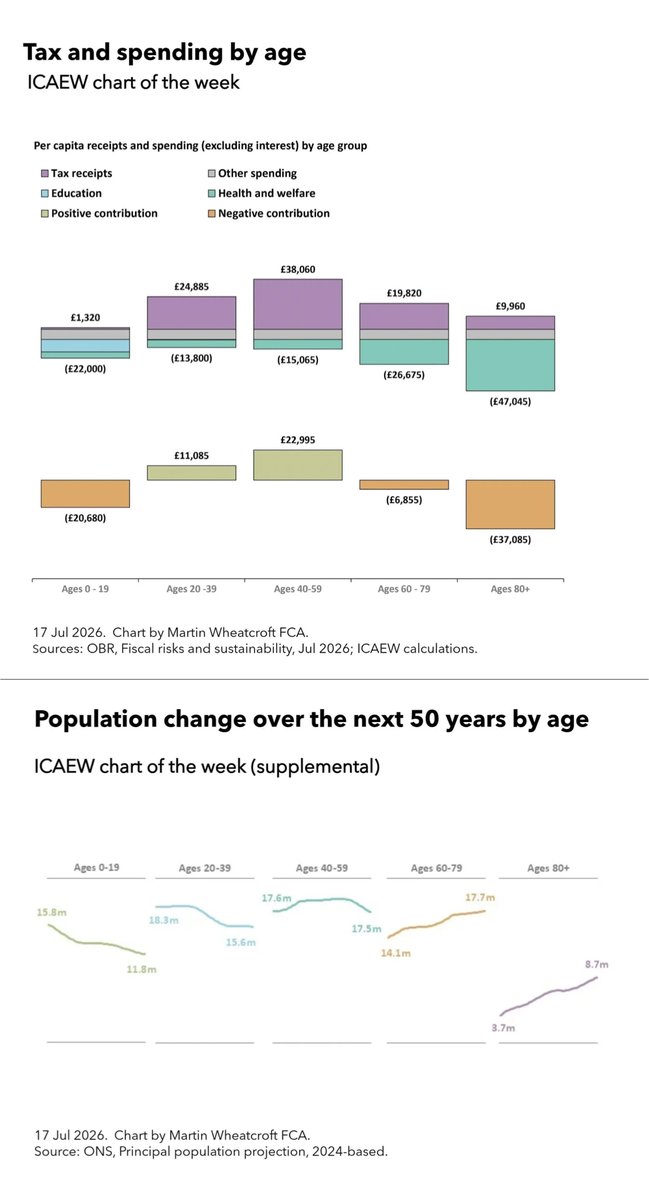
My #icaewchartoftheweek for @ICAEW welcomes in our new First Lord of the Treasury @andyburnham with a couple of charts on the age profile of the population - one of the main reasons for the OBR projection that public sector net debt could reach 300% of GDP (or more).
While fewer children should mean less spending on education, the large rise in older generations will have big implications for the cost of health and welfare (including the state pension).
My #icaewchartoftheweek for @ICAEW is a triple celebration: Canada Day marking 159 years as a self-governing nation, a historic men's World Cup win, and the (relatively) healthy state of Canada's federal government finances.
Read more: https://t.co/XqNpl08IrW
My latest #chartoftheweek for @ICAEW is on the current plan to deliver a current budget surplus in the public finances that the incoming prime minister and chancellor (whoever they be) will inherit from their predecessors.
Read more: https://t.co/3K9yZ5hcXK
My #icaewchartoftheweek for @ICAEW is on the unemployment rate of 5% and employment rate of 75% this week and how they don't add up to 100%.
Read more: https://t.co/uTAayypRxo
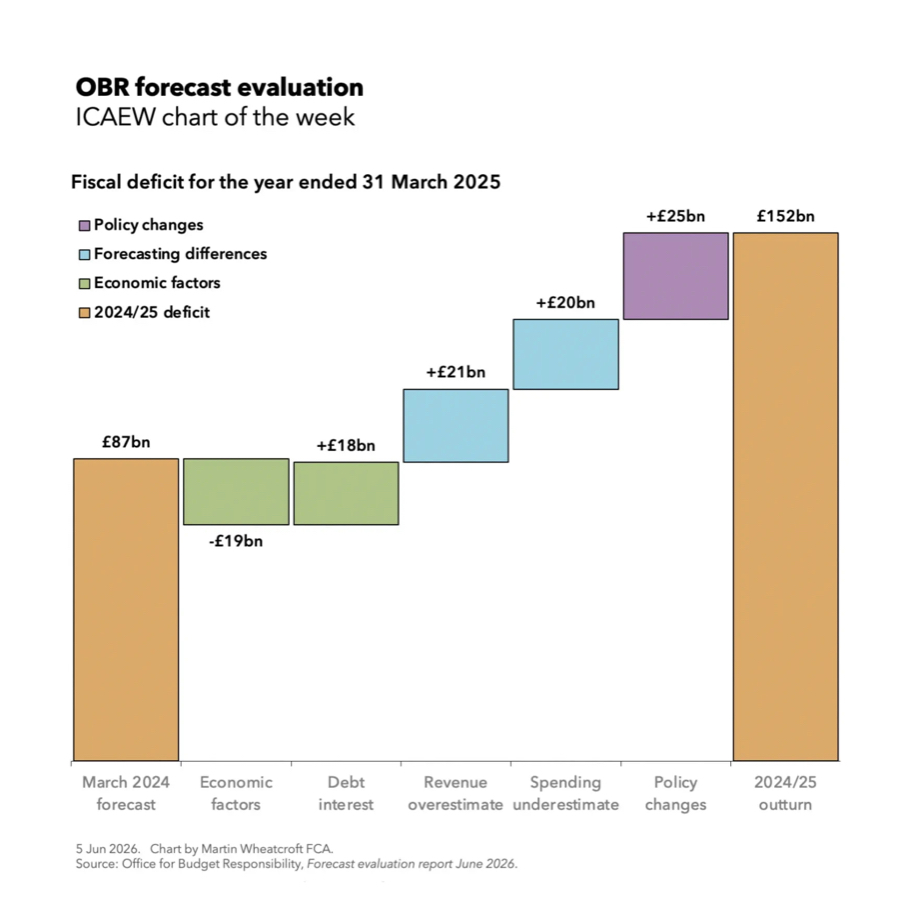
My #icaewchartoftheweek for @ICAEW is on the OBR's latest forecast evaluation report, showing the big differences between the March 2024 one-year forecast for the 2024/25 fiscal deficit of £87bn and the £152bn outturn.
Read more: https://t.co/oySqucnaQA
@BenZaranko@anandMenon1 The main problem is the 5 year forecast period, as while the OBR does incorporate the growth benefits of both public and private investment most of the return will inevitably be beyond 5 years, especially with a couple of years to get through planning and then time to build.
My #icaewchartoftheweek for @ICAEW is on the top 20 military spenders in 2025 according to @SIPRIorg. The NATO plan to up it to 3.5% of GDP should see the size of the blue circles other than the US increase significantly over the coming decade. Read more: https://t.co/couOTU9SNY
@DanNeidle The good news is that governments (in theory) are able to work to longer timescales. Relatively small incremental changes each year could make a big difference over a quarter of a century.
Of course that means having a plan.
My #icaewchartoftheweek for @ICAEW is on how the number of people aged 65+ is projected by the @ONS to rise by 34% over the next 25 years, in contrast with a 1% rise in working age adults.
This will be a major challenge for the UK’s public finances.
https://t.co/ST5vRbB8JZ
As the accompanying article sets out there is a lot more going under the hood with a 9% drop in those living in couple households with 3+ dependent children, a 30% increase in those over 65 living alone, and a 30% increase in lone parent families.
https://t.co/SWUcUUx1LQ
My #icaewchartoftheweek for @ICAEW is on how the overall shape of the households we live in has not really changed over the last quarter of a century.
Read more: https://t.co/SWUcUUx1LQ
Visually the proportions look very similar, even though there has been a 0.4 percentage point (pp) reduction in the proportion living in families with children, 0.3pp fewer living in a couple without children, 0.5pp more living alone or sharing and 0.2pp more living elsewhere.