🟦 THE MW EDGE IS NOT ABOUT NEEDING A HUGE MOVE
When you DCA into a short properly and increase size only at the right levels, you improve your average entry as price pushes higher.
That changes the math completely.
The market may need a much bigger move higher to keep squeezing shorts…
while you only need a smaller move back down to move into profit.
That is the advantage of:
patience
scaling
timing
increasing size only where the risk/reward improves
You don’t need to catch the exact top.
You need to build the position so the market needs less to pay you.
That is the #MW way.
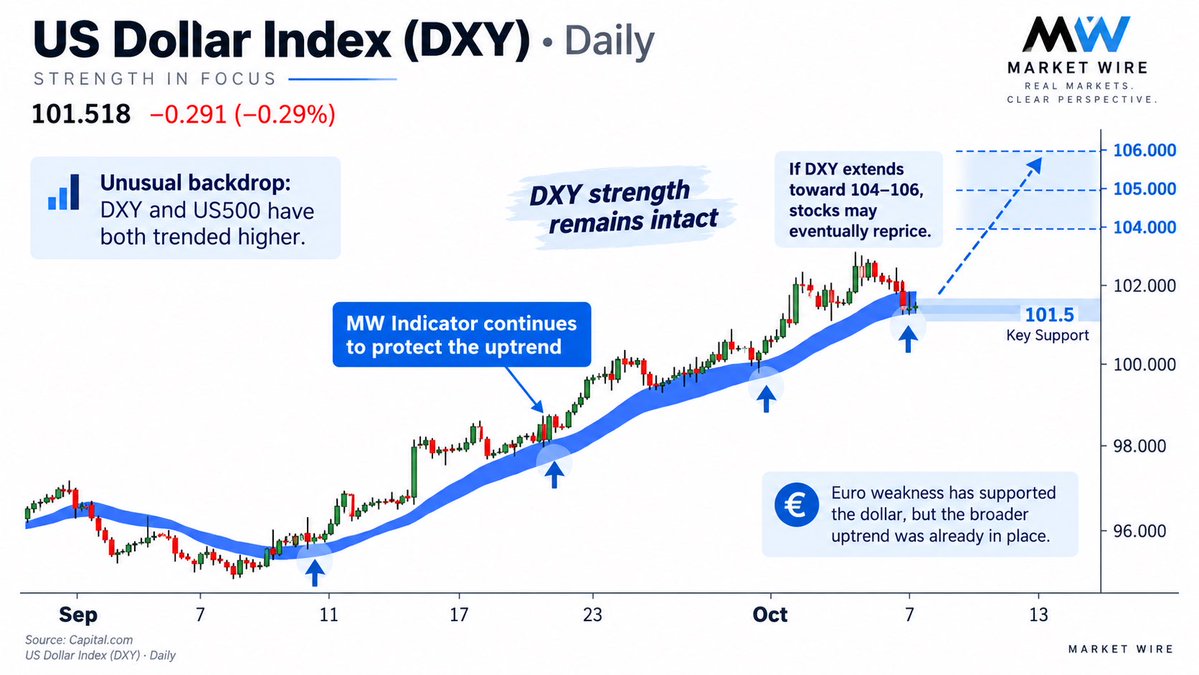
US Dollar Index ($DXY) is one of the most important charts in markets right now.
🟦 On the daily timeframe, the MW Indicator continues to protect the uptrend.
🟦 Every meaningful pullback has so far been supported, keeping DXY strength intact.
🟦 As long as that remains the case, the path toward 104–106 stays on the table.
What makes this even more interesting is the broader market backdrop:
🟦 Normally, when the US Dollar rises, equities struggle.
🟦 But this time, we have seen something unusual: DXY and the US500 have both been trending higher together.
🟦 That is not something markets usually sustain forever.
Part of this move can be explained by euro weakness, but that alone does not fully explain the broader strength we have been seeing in the dollar trend.
The market is effectively telling us that, for now, stocks are still willing to ignore the pressure coming from a strong dollar.
But history also teaches us something important:
🟦 When markets temporarily disconnect from macro pressure, that disconnect is often temporary.
🟦 At some point, if the dollar keeps pushing higher, the pressure usually begins to show up elsewhere.
🟦 That is why DXY may be one of the most important leading indicators to watch from here.
🟦 If DXY continues to extend higher, commodities could come under more pressure.
🟦 More importantly, the financial markets could eventually face a meaningful correction if the dollar continues its advance.
So the key question now is simple:
If DXY keeps climbing toward 104, 105, or even 106 , when will stocks finally start reacting?
That is the major macro signal to watch right now.
Watch DXY closely.
Because if the dollar keeps strengthening, the repricing in risk assets may only be a matter of time .
🚨 JAPAN → FRANCE → EURO → DXY: A MACRO CHAIN TRADERS SHOULD WATCH
Something important is developing underneath the surface of global markets.
🟦 JAPAN IS PULLING BACK FROM FRENCH DEBT
Japanese investors have been reducing exposure to French government bonds as domestic Japanese yields become increasingly competitive.
This is NOT Japan “dumping the euro.”
It is capital becoming less willing to travel abroad for yield.
🟦 FRANCE IS THE PRESSURE POINT
French bond yields have surged to levels not seen since 2002.
The French 10Y spread versus Germany has widened sharply as investors demand more compensation for France’s debt, deficit and political risk.
Foreign investors own a large part of the French government-bond market making foreign demand extremely important.
🟦 EURO / DXY
France’s fiscal stress is already weighing on the euro.
EUR/USD is trading around $1.12, while DXY has recently pushed near 102.
Remember:
EUR weakness = major support for DXY.
The euro represents roughly 58% of the Dollar Index.
France stress ↑
EUR ↓
DXY ↑
🟦 FRENCH STOCKS
The stocks I’m watching first are the financials:
$BNP
$GLE
$ACA
$CS
If French bond spreads keep widening and banks begin significantly underperforming, that becomes a much more important warning signal than the CAC alone.
🟦 JAPAN / NIKKEI
For now, the Nikkei has NOT broken down because of this.
Japanese equities are still benefiting from broader risk appetite.
But the risk changes if capital repatriation strengthens the yen while global markets turn risk-off.
JPY ↑ + global risk-off = a much tougher environment for Japan’s large exporters.
🟦 THE TRADE MAP
French OATs ↓
→ French yields ↑
→ OAT/Bund spread ↑
→ French financials vulnerable
→ EUR/USD pressure
→ DXY support
Meanwhile:
Higher Japanese yields
→ less incentive to own European bonds
→ capital potentially returns to Japan
→ potential JPY support
→ potential pressure on Japanese exporters
This is not a French debt crisis yet.
But it is exactly the type of cross-market setup serious traders should be watching before everyone starts talking about it.
#MWMarketWire
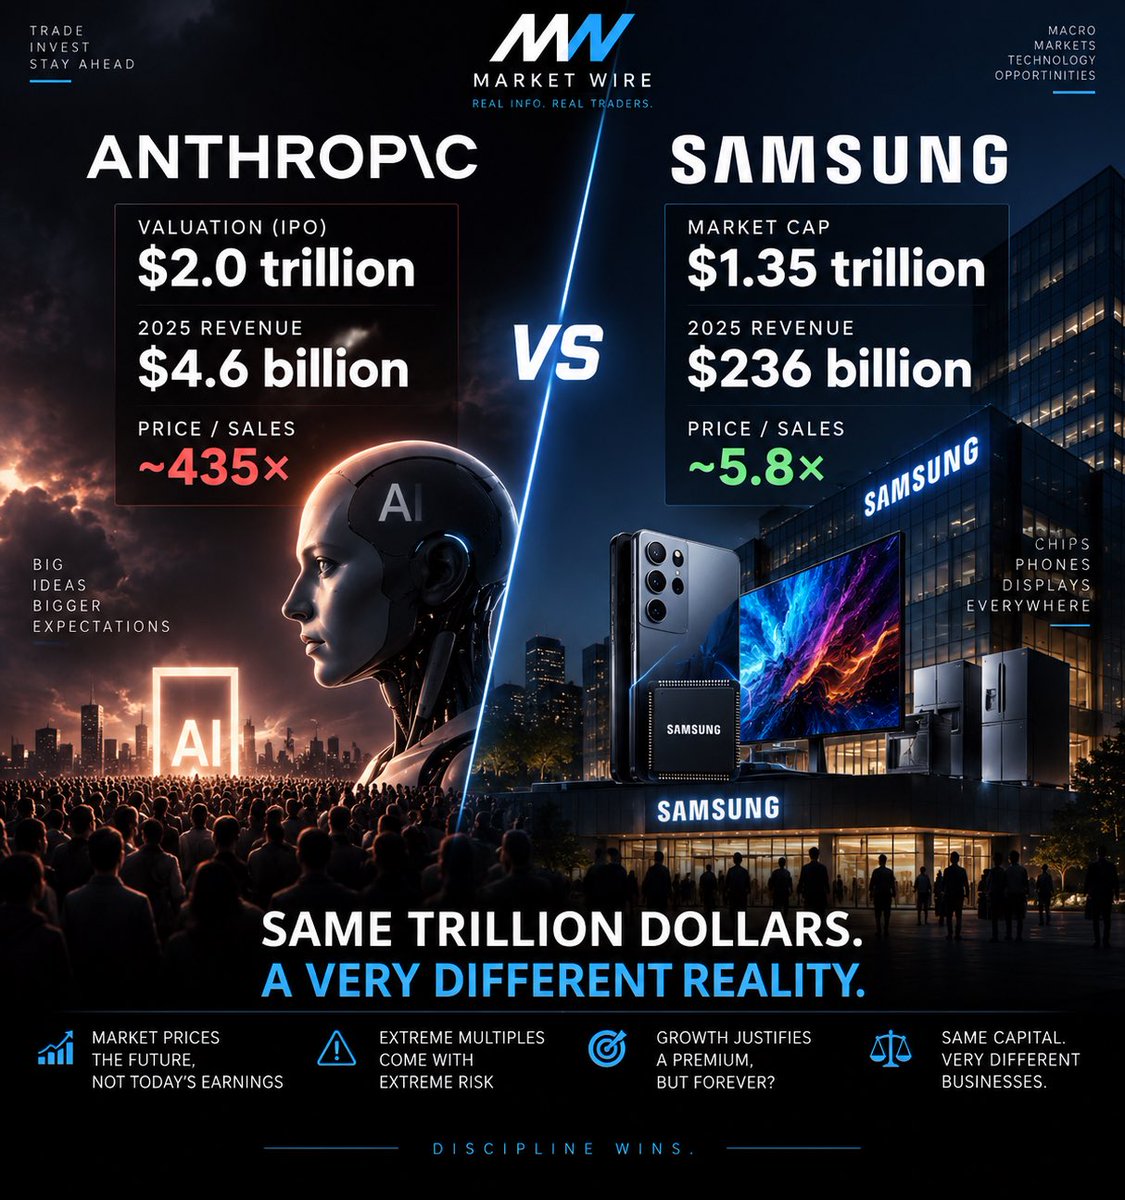
ANTHROPIC IS TARGETING A $2 TRILLION VALUATION.
SAMSUNG IS WORTH ~$1.35 TRILLION.
Now look at the revenues.
🟦 Anthropic 2025 revenue: ~$4.6B
🟦 Samsung 2025 revenue: ~$235B
Anthropic is targeting an IPO valuation of more than $2 TRILLION, while Samsung Electronics currently has a market cap of roughly $1.35 TRILLION.
Put that against 2025 revenue:
Anthropic: ~435× revenue
Samsung: ~5.7× revenue
Samsung generated roughly 50× more revenue in 2025 — yet Anthropic is targeting a valuation substantially higher than Samsung’s entire market cap.
This is what traders need to understand about the AI cycle.
The market is not pricing what these companies earn today.
It is pricing what investors believe they can dominate tomorrow.
And that works extremely well…
Until expectations change.
If AI revenue growth disappoints while compute, memory, infrastructure and energy costs keep rising, these extreme multiples can compress very quickly.
🟦 TRADER WATCHLIST
$NVDA • $MU • $SNDK • $AVGO • $AMD • $ORCL
AI can be revolutionary and still be extremely expensive.
Both can be true at the same time.
#MWMarketWire
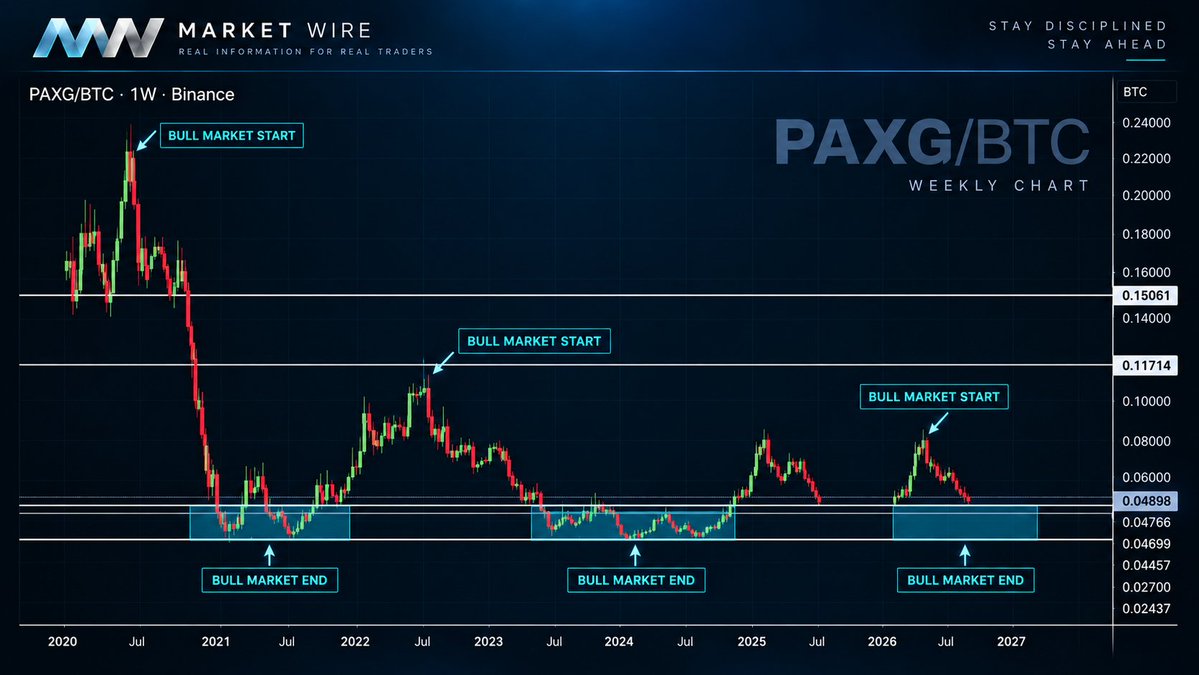
🟦 @MWhalekiller FLAGS A MAJOR GOLD-vs-BITCOIN LEVEL
A fresh weekly analysis from @MWhalekiller shows the PAXG/BTC ratio returning to a longterm support zone that has previously marked important relative turning points.
The chart is built in his typical style: simple structure, major historical levels, and focus on where price repeatedly reacted before , not on short-term noise.
🟦 WHY IT MATTERS
If PAXG/BTC holds this zone and turns higher, it would signal gold beginning to outperform Bitcoin on a relative basis.
If the level fails, Bitcoin continues to maintain the upper hand versus gold.
For traders, this is not about predicting the next candle.
It is about watching a level that has mattered before and waiting for the market to confirm the next move.
Analysis: @MWhalekiller
🚨 MU’S BLOWOUT EARNINGS MAY ACTUALLY BE A WARNING FOR THE AI BOOM
Everyone is celebrating Micron’s massive numbers.
And yes ,for $MU, they are incredible.
But I see something else.
🟦 MEMORY IS BECOMING MORE EXPENSIVE
AI demand for HBM and memory remains enormous.
Scarcity = pricing power.
Great for Micron.
But remember:
Micron’s higher revenue is somebody else’s higher cost.
And that somebody is increasingly the AI industry.
🟦 LOOK AT WHAT AI ALREADY REQUIRES
GPUs.
HBM / memory.
Data centers.
Electricity.
Cooling.
Networking.
And increasingly: DEBT.
Now add higher memory prices and expensive financing.
The infrastructure bill keeps getting bigger.
🟦 BUT WHERE IS THE RETURN?
This is the part almost nobody wants to discuss while AI stocks keep making new highs.
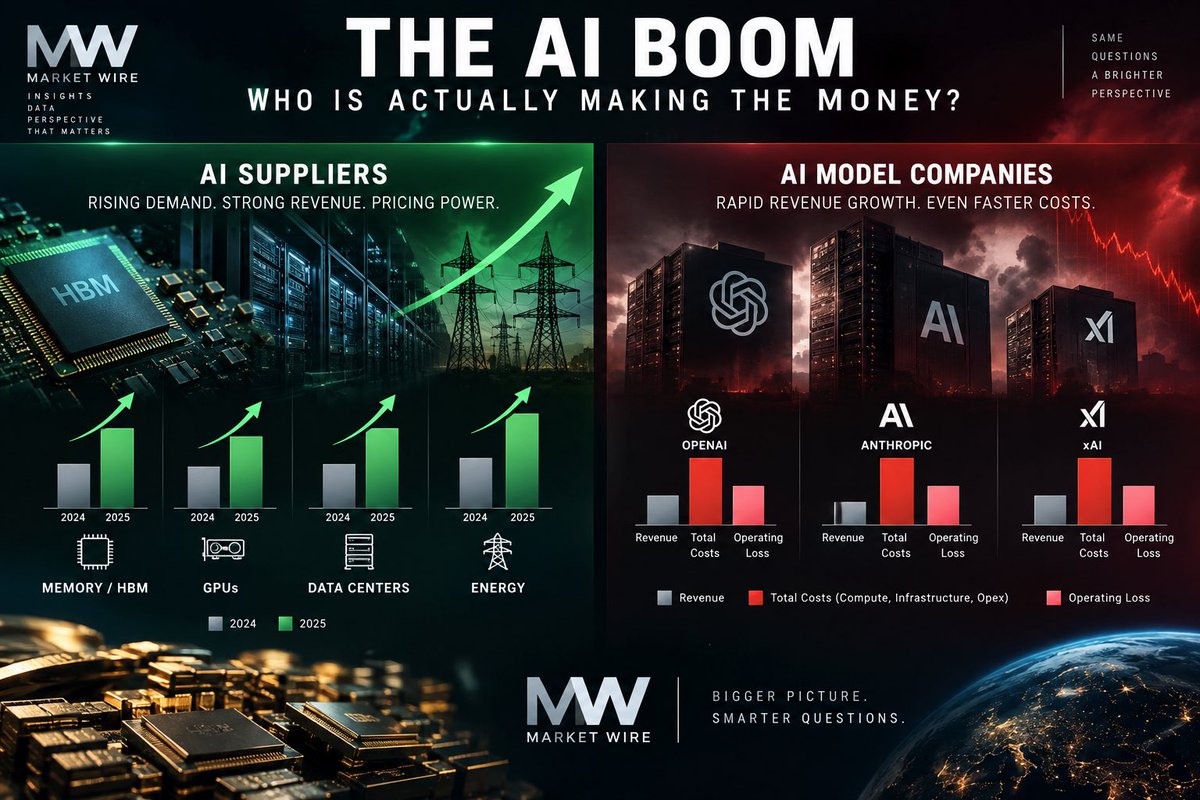
OpenAI, Anthropic and xAI are growing revenues rapidly.
But they are also burning enormous amounts of capital building and operating AI.
And at the same time, competition is pushing the price of AI lower.
DeepSeek.
Chinese models.
Open-source models.
More competition every month.
So think about this:
The inputs are scarce and expensive.
While…
The output is becoming cheaper.
🟦 THIS IS THE AI PARADOX
AI can become one of the most important technologies in history…
and the investment boom behind it can STILL become financially unsustainable.
Because technological success does not automatically equal:
PROFIT.
$MU gets paid.
$NVDA gets paid.
Data centers get paid.
Energy companies get paid.
Creditors get paid.
But who ultimately captures enough profit to justify the TRILLIONS being invested into AI?
That is the question I believe the market is massively underestimating.
🟦 MU’S NUMBERS DIDN’T MAKE ME MORE BULLISH ON THE AI BOOM.
They made me question its economics even more.
AI demand is real.
The technology is real.
The spending is real.
But where is the return?
#MWMarketWire
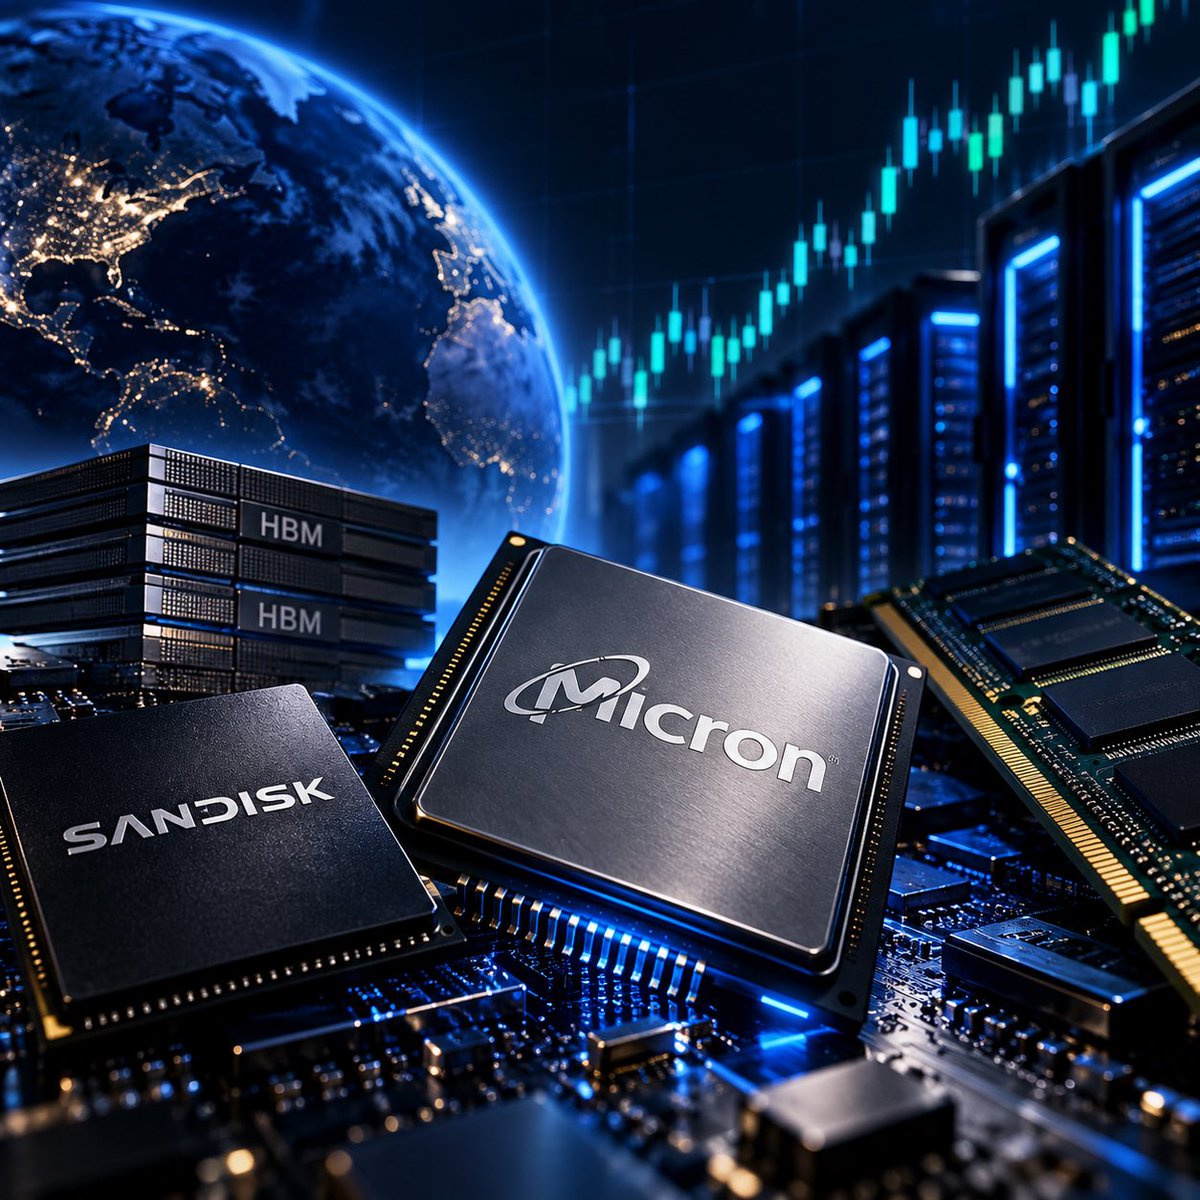
🚨 MICRON EARNINGS TONIGHT MEMORY STOCKS ON WATCH
Micron $MU reports Q4 FY2026 earnings after the U.S. market close today.
🕥 Earnings call: 22:30 CET
🟦 WHY IT MATTERS
This is NOT just about $MU.
Micron is one of the world’s major DRAM, NAND and HBM producers.
Its results and forward guidance could give traders an important read on memory demand, supply and pricing across the sector.
🟦 KEY FOCUS
▪️ HBM / AI memory demand
▪️ DRAM pricing
▪️ NAND pricing
▪️ Data-center demand
▪️ Memory supply conditions
▪️ Margins
▪️ Forward guidance / Q1 FY2027 outlook
🟦 MEMORY STOCKS TO WATCH
👀 $MU — DRAM / NAND / HBM
👀 $SNDK — NAND / enterprise SSDs
👀 SK Hynix — DRAM / NAND / HBM
👀 Samsung — DRAM / NAND / HBM
👀 Kioxia — NAND
⚠️ $SNDK is especially important to watch.
SanDisk has major exposure to NAND and data-center storage, making Micron’s commentary on NAND pricing, supply and AI/data-center demand highly relevant.
🟦 TRADER NOTE
A major surprise in pricing, demand or guidance could create volatility across the memory and semiconductor trade.
And remember:
📅 MONTH-END
📅 QUARTER-END
📊 MU EARNINGS
A lot for traders to watch today.
MW MARKET WIRE
Only what matters to your trades.
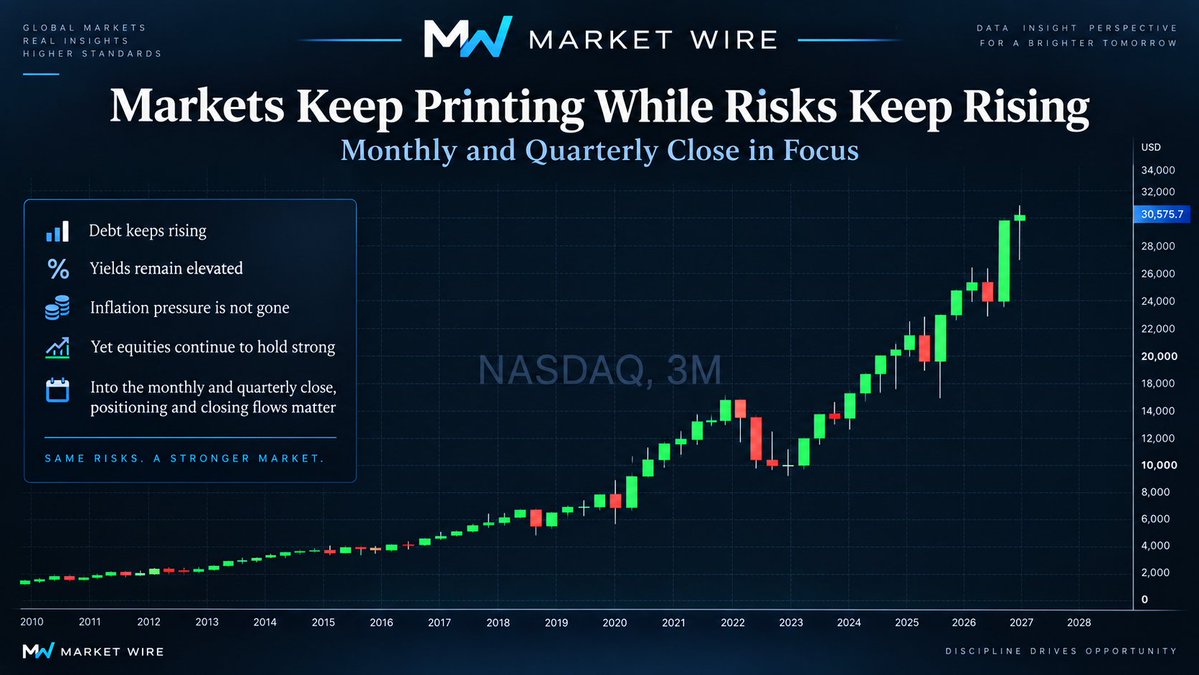
🔹 PCE TODAY
August PCE came in at +0.3% MoM / +3.4% YoY.
Core PCE came in at +0.2% MoM / +3.0% YoY.
The softer inflation print pushed equities higher and reduced some nearterm pressure around another Fed hike.
🔹 DEBT & YIELDS
U.S. debt remains near $40 trillion, while the 10-year Treasury yield is still near multi-decade highs.
🔹 ENERGY & INFLATION
Oil remains elevated after a strong September, keeping pressure on the inflation backdrop.
🔹 AND STILL…
U.S. equities remain remarkably resilient, with the S&P 500 and Nasdaq holding close to record territory despite tighter financial conditions.
🔷 TODAY MATTERS EVEN MORE
We are heading into both the monthly and quarterly close.
That can bring important rebalancing and positioning flows into the final hours of trade. Reuters also flagged quarter end rebalancing as a factor in today’s market.
🔷 THE BIGGER PICTURE
A rising market does not mean the underlying risks disappeared.
Liquidity, positioning, earnings and confidence can keep markets elevated much longer than fundamentals alone would suggest.
Trade what is in front of you.
But never confuse a rising market with a healthy system.