The only edge in markets that never gets arbitraged away — from a crypto quant running Sharpe ~4:
Leigh Drogen (@LDrogen), CIO of Starkiller Capital. Sharpe ~4. Started his career as a quant at a NY equity hedge fund.
Drogen:
"If the only thing you ever did was put a 50-day moving average on Bitcoin — long when above, out when below — you would massively outperform everything."
"You would stay out of the massive puke-inducing crashes."
"If you knew nothing — couldn't tell Ethereum from the Nth lending protocol — and just bought the top 20th percentile by 30-day return and shorted the bottom 20th, you'd make a whole bunch of money."
"What is the intrinsic value of Dogecoin? Nothing. You could make the case Bitcoin has no intrinsic value either."
"The vast majority of assets in digital asset space have no intrinsic value — which is why cross-sectional momentum works so well."
"Momentum is the only persistent alpha in all markets. All other alpha gets arbitraged away. Human behavior never will."
I recorded a 1-hour video guide on how I use TradingView
This is beginner-intermediate friendly.
I include theory, chart examples and also give away all the code for 3 custom indicators that I built.
I'll also put all of relevant resources in a post below this one.
0:00 The 2 Main Problems On The Charts Of Most Traders
0:47 Lesson 1: Candlestick Basics
6:38 Lesson 2: Volume (Full Guide)
20:55 Lesson 3: Support and Resistance (Full Guide)
30:51 Lesson 4: Setting Up Trading Indicators
34:37 VWAP (Full Guide)
42:44 Free Custom Volume Indicator
47:24 Free Custom S/R Levels Indicator
52:39 Lesson 5: Setting Up Trade Alerts
59:42 Lesson 6: Setting Up a Watchlist
1:18:40 Free Trading Strategy Guides
Most traders enter trades because the chart "looks good."
That is not an entry. That is an opinion.
This educational post is sponsored by @_WOO_X, where I trade crypto with zero fees on spot.
Every trade I take has to answer 3 questions before I pull the trigger: where is the context, where is the location, and where is the confirmation?
And the answers change completely depending on whether the market is trending or ranging.
Before anything else, you need to know what market you are in.
A trending market makes higher highs and higher lows (or the opposite).
A ranging market rotates between two clear levels.
Using trend rules in a range will chop you to pieces. Using range rules in a trend will get you run over.
Get this wrong and nothing else matters!
In a trend, I only trade with the trend. No counter-trend heroics.
In an uptrend, I only take longs at Higher Lows.
In a downtrend, I only take shorts at Lower Highs.
Where I look for these entries: key levels from prior structure, Fibonacci pullback zones (typically 0.5 to 0.75), and clear supply/demand areas.
What confirms the entry: an LTF structure shift in the direction of the trend, combined with RSI divergence at the HL or LH.
The Higher Low alone is not enough. Without LTF confirmation, there is no trade.
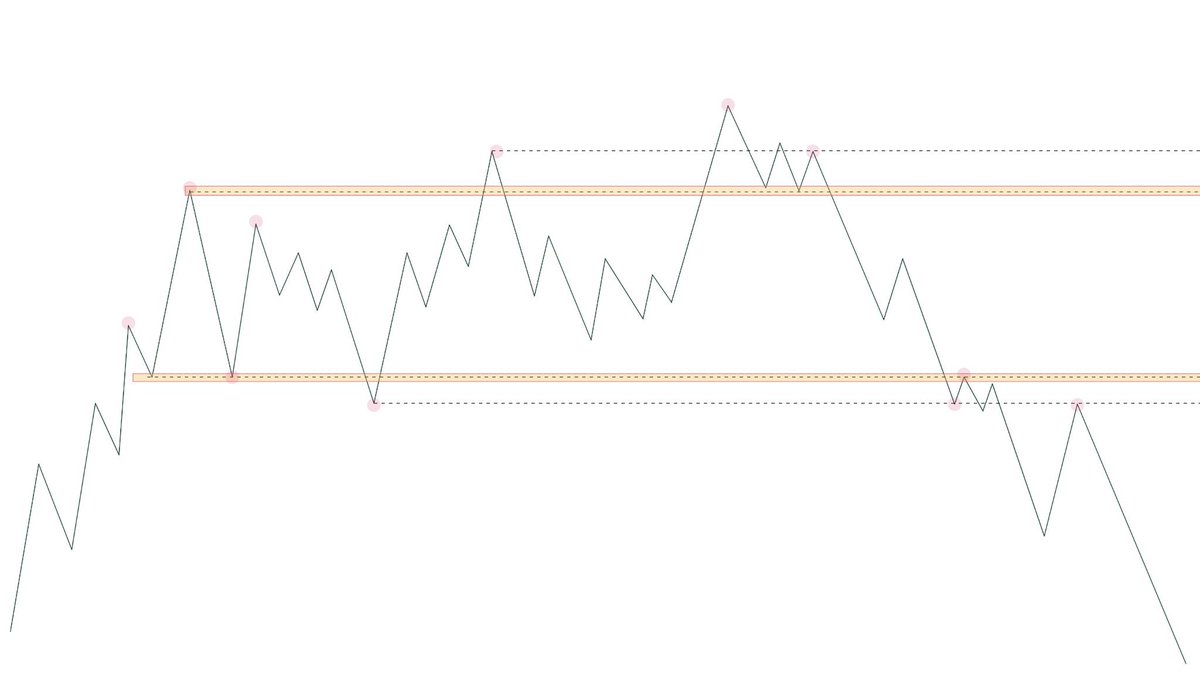
In a range, I only trade the extremes. Never the middle.
At range high, I only look for shorts, and only on a deviation — when price breaks above the high, sweeps liquidity, and closes back inside.
At range low, same logic in reverse — only longs on a fake-out below.
Where I look: key levels inside the range, the deviation itself, and the LTF market structure break.
What confirms: the deviation sweeps liquidity and closes back inside the range, an LTF MSB in the opposite direction of the sweep, and RSI divergence on the deviation.
Middle of the range? No trade. Ever.
Notice what is the same in both scenarios: LTF structure shift + RSI divergence.
That is the actual trigger.
The context (trend or range) tells me WHERE to look.
The LTF structure and divergence tell me WHEN to pull the trigger.
Without the trigger, I wait. I do not force. I do not "feel it out." I wait for the chart to tell me it is time.
This framework does one thing above all else: it keeps you out of bad trades.
It forces you to define context before entry.
It gives you specific locations to watch. It requires confirmation before you commit.
Most losing trades happen because the trader skipped one of these three steps.
They entered in the middle of a range.
They shorted in an uptrend.
They entered without a trigger and called it "conviction."
Conviction without structure is just hope.
3 entry triggers. 2 scenarios. 1 discipline.
Context → Location → Confirmation.
If your trade does not tick all three boxes, it is not a trade. It is a gamble.
All this free educational content is sponsored by my partner @_WOO_X. Zero fees on spot. If you trade, trade with me:
🔗 https://t.co/iWxTrgYsA3
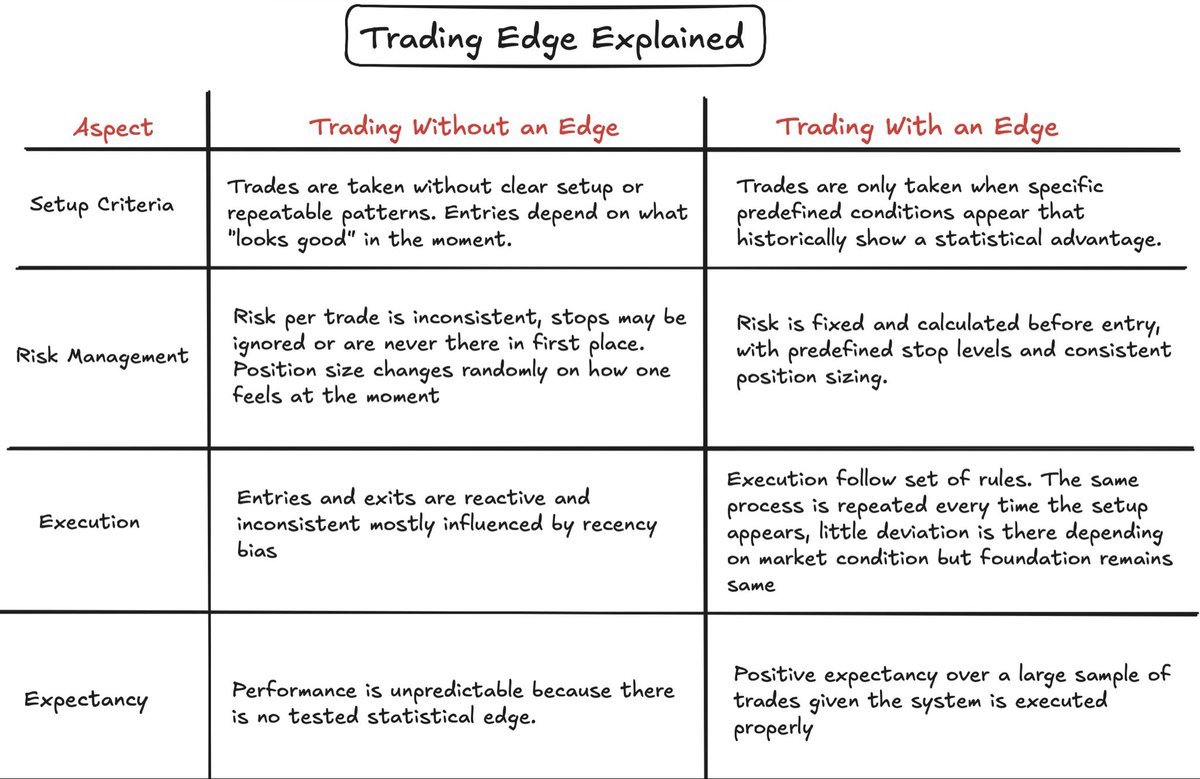
"Edge" is thrown around a lot but not much explanation is given as to what it actually means.
Below is what I classify as "edge" on different aspects of trading
For those drained by these hard market conditions last couple of weeks, remember what a great philosopher once said:
Losing is not and has never been a fking option
You literally have to think this way and never let anything get in your way
You can fall 150 times, get the fk up and rise
This state of mind is the path to enter THE ZONE
The great philosopher is me by the way.
Head up.
Big F.
The Best Scalping Strategy
0:00 - Step 1: Mark the Daily Highs and Lows
0:43 - Step 2: The Scalping Setup
1:06 - Step 3: Entry
2:21 - Real Trade Examples
2:47 - Day 2 Examples
3:57 - Day 3 Examples
4:31 - Risk/Reward Results
Tick Count
This is correlated to Volume, but basically it shows how active the participants are for a certain coin.
If a coin is going psychotic, playing breakouts is generally so much easier.
If a coin feels dead, slow and boring then playing reversals is going to be easier.
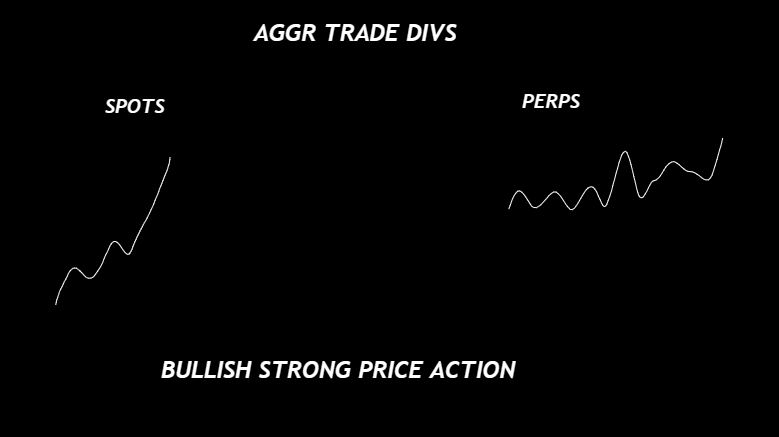
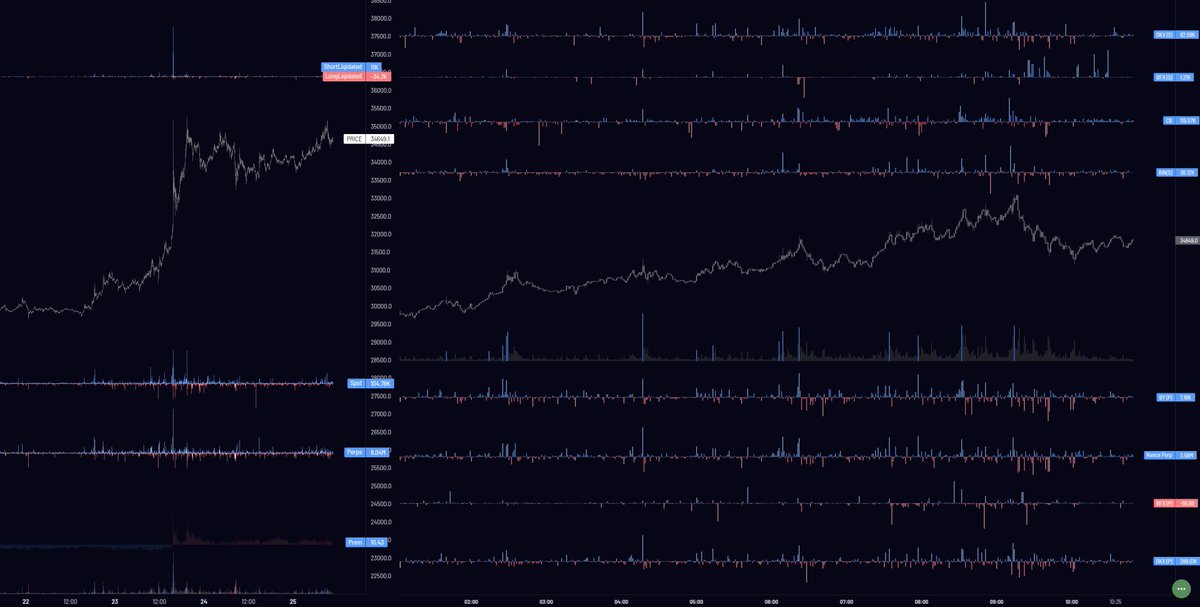
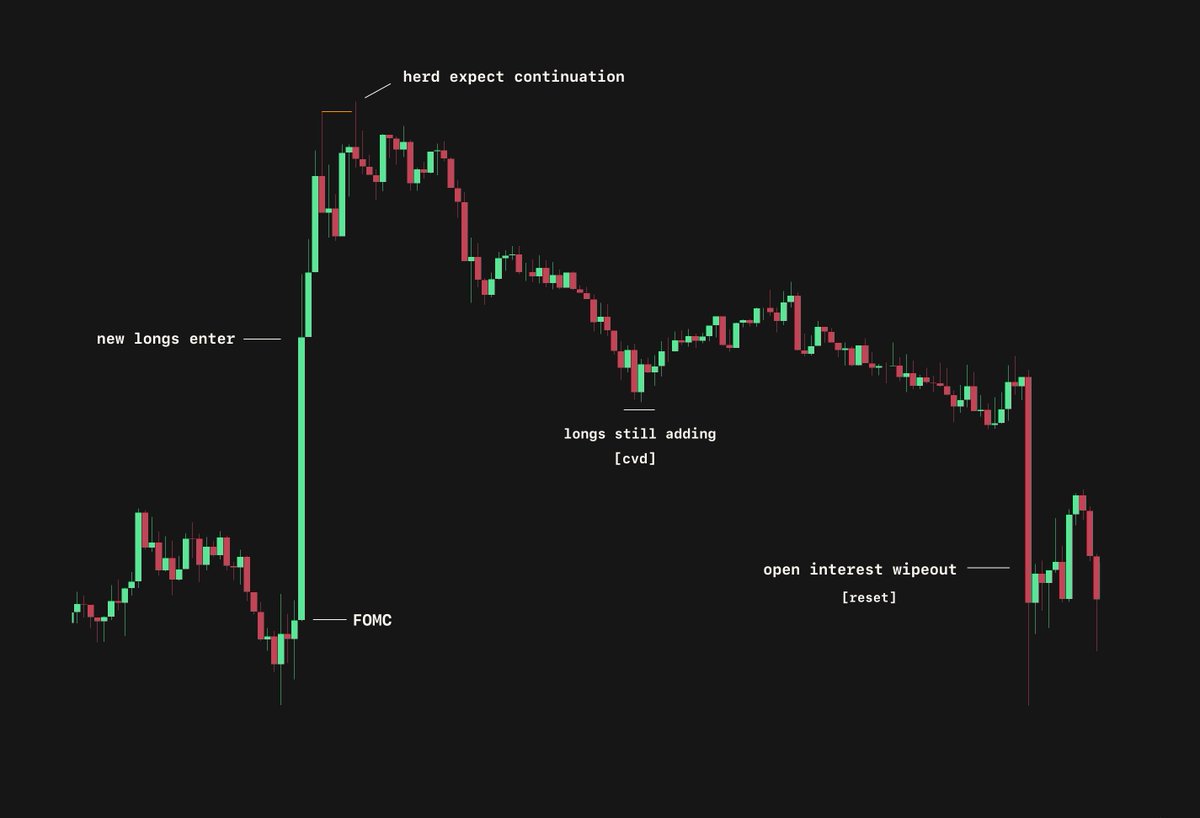
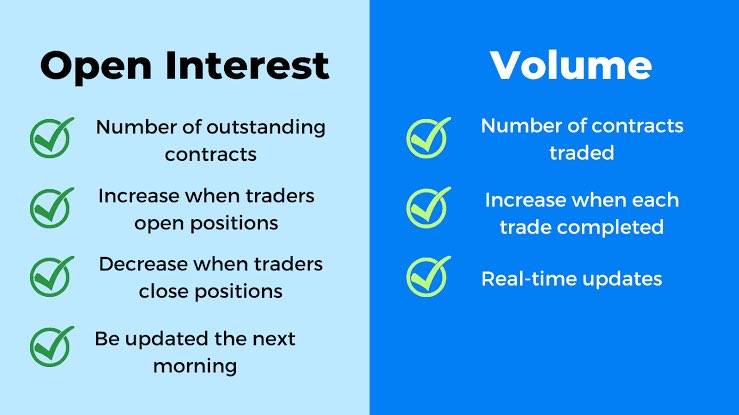
Stop looking at 1000 indicators. Focus on Price, OI and Volume
* Charting ETH & BTC, And A Guide To Open Interest
In perps open interest (OI) refers to the total number of contracts (long or short) that are currently open and have not yet been closed.
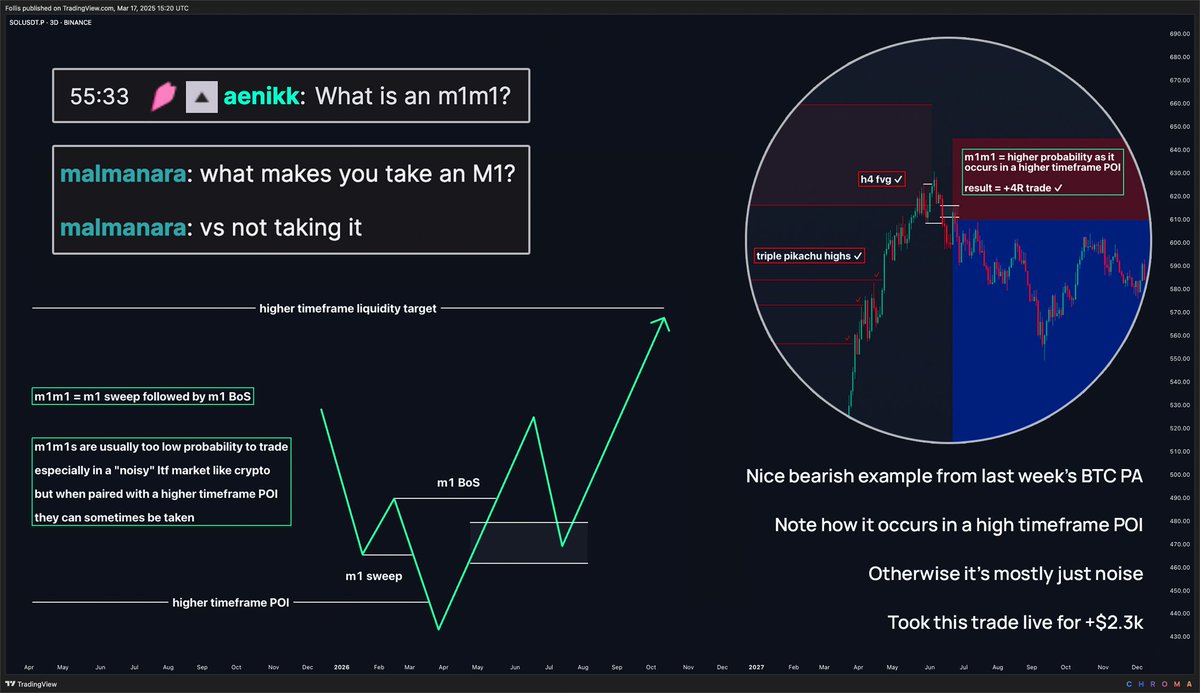
Low Timeframe mXmXs
- mXmXs are the building blocks for reversals in structural price action
- Price is fractal, so mXmXs can occur on any timeframe
- Lower timeframes are often "noisier" due to having less price data than higher timeframes, and therefore be less reliable
- LTF mXmXs can be notoriously low probability
- But you can still trade them when paired with higher timeframe POIs (as per my $BTC example on the chart)
Setups can occur on any timeframe, but higher timeframes are usually more reliable because the datasets involved are bigger, meaning there are fewer statistical outliers, and therefore a lower likelihood of false positive information
Ultra-low timeframes like the m1 are less reliable because the dataset is 60X smaller than the h1, and 1440X smaller than the d1
So there is more of a chance for outlier datapoints to mess with your dataset
As long as you take this into consideration, then you're good
End of the day price action is just a tool. Timeframes are just a tool. Candlesticks are just a tool
Focus less on the tools themselves, and more on what information you want those tools to give you
Good luck out there 🤝
Important concepts in trading
RISK MANAGEMENT. There is NOTHING more important in trading then Risk Management. You could have every other aspect of trading dialed in, and still lose money without it. Risk Management is the key to profitability in trading.,
What are the key factors of Risk Management? I Never risk more than 1-2% of my trading capital on a single position. When you plan trade with risk management, first you must know where you are entering and why, then you must know where your trade is invalidated and why (stop loss placement). You Calculate how far away your stop loss is, and then you calculate your position size based on the distance between your entry, and your technical invalidation. (The caveat to the 1-2% rule in crypto, is that the market is heavily correlated. So if you have multiple altcoin positions open in the same direction, each with 1-2% risk, your overall risk is likely much higher, as the market tends to move together)
PATIENCE IN ALL THINGS. Patience is such an important part of trading. First, give yourself a reasonable time horizon to develop your skills and knowledge base. In the context of the LATF, give yourself time to go through the educational content, give yourself time to deploy those concepts onto charts, and to take simulated trades with a paper trading account. Be patient about deploying real capital into the market. Make sure you are confident and comfortable with your ability to navigate the market, and manage your risk. Be patient with your entries. Let trades come to you, don't chase them. Preparation, patience, execution. The majority of your time as a trader is spent waiting. The Market isn't going anywhere, there is no rush.,
DISCIPLINE. Seeking Inspiration and motivation to accomplish your goals is a great way to get started but without the discipline to put in the work each day, and to adhere to your trading plans, you won't make it far. Prepare yourself mentally for the reality that the inspiration will fade, and many days progress won't be easy, fun, or as fast as you want it to be. It might help to set your major goals on 2-3 year time horizons, not 2-3 weeks.
PROCESS OVER OUTCOMES. As traders, we control the process but we don't control the outcomes. Put your focus on the process each day. Preparation, patience, execution. Preparation, patience, execution. Preparation, patience, execution.,
We don't control what happens after that. Technically valid trades, with technical invalidation, with technical targets, and risk management. After that, the outcome of a trade is irrelevant. The only way to move freely in and out of the market is to let go of the outcome and focus on the process.
SELF REFLECTION. Everyone has their "demons". They manifest themselves in our trading in different ways. The best way to identify and overcome them, is to track your trades with journaling, and reflect on them. A journal entry might look like these.,
Notes. Example 1 . "Price failed to reach my target, I didn't want to miss my short trade, so I entered at the bottom of the local range, Then price rallied and I stopped myself out at a large loss right before my initial entry target. When my target hit, I took a larger position then I planned to make up for the loss. But because the position was so large, I ran my stop closer then I planned, because I was afraid to take a stop with that size. Price wicked up and stopped me out, and then started dumping quickly. I didn't want to re-enter because I just took 2 stop losses. Had I followed my original plan, I would have been in the position and not gotten stopped out. Execution Poor" ❌
Example 2. "Price came to my target, I took the trade as planned. Price stopped me out at invalidation, execution perfect" ✅
Example 3 "Price Swept the major low, I had been waiting for this level for a month. In the moment, I decided to trade it 5x bigger then planned. I was incredibly nervous and anxious, fighting not to close the trade out before invalidation. Price ultimately went in my favor. I closed half out for a large win, and set my stop at break even. Execution Poor"❌
Eventually you will see repeating issues in your trading. You will find yourself writing the same thing over and over again. Identifying recurring issues gives you the opportunity to address them. The end goal will be to reflect on a journal that looks like this "execution perfect",✅ "execution perfect",✅ "execution perfect". ✅