UK trader and Investor. Learning to manage emotions and the mind while trading. Passionate improver. Financially, mentally and physically. Enjoy the ride!
How can you Master Your Mind and emotions when trading?
You enter a trade, stop-loss is set, eyes on the chart, and the "support" you bought has failed. Price is tumbling, your stop-loss is about to get hit. You panic. Remove the stop-loss. What next?
TL:DR in comments 👇
You have to go through a number of grueling phases. I feel like I'm in phase 3 right now. Learn the lessons and continue to improve, constantly!
Phase 1
A post on X, a Youtube vid or a reel on Instagram catches your attention. Thousands made in minutes or hours from the comfort of you phone or laptop.
You seen a line or candles move up or down, and this is all you need to know to make mega money? You're in.
You deposit some funds into an account. Your 1st trade is a winner. You've earned 10% profit in a matter of minutes. Your 2nd trade is a winner. This time you've added some leverage - by accident - and you've doubled you money.
Endorphins are coursing through your body and you feel invincible. You can't wait to trade again!
You've traded some support and resistance, order blocks, and just seen a new video on Bollinger Bands and decide "I'll give that a try".
3rd trade, and it's all gone in minutes. You've been margin called. You didn't even really know what the stop-loss button meant. But that was a rush and a high you can't wait to chase again.
Phase 2
Start over. Deposit more money into your account. You decide trading larger amounts is what's next. If you can cut out the loss, £10,000 can become £20,000 in no time. Especially with that leverage stuff.
This time you have 4 profitable trades in a row. Smaller gains before you cash out the 4th trade early, in profit, but it rockets way higher and you leave money on the table.
Next trade is catastrophic. You're chasing another win but the money left behind from that last trade plays on your mind. You get greedy and the price drops. You have a stop-loss but remove it to buy again and lower your average. Price bounces. Genius.
You're almost back to break even and then it happens. The support breaks, price is falling rapidly, you're deep in the red. £2,000, £4,000, maybe £8,000 has gone. You're margin called.
The pain and disappointment is eating away at your soul. "I've saved that for the last 2 years." It's gone.
This is the make or break phase. Give up, cut your losses and never do this again. Or learn, I mean really learn. Work on your discipline, study the charts, LEARN your lesson.
Phase 3
You decide, this is for me. The pain is still raw, but you're willing to do what it takes to succeed.
You learn the charts, you learn more indicators but instead of using them blindly, you back-test, understand that trading is probabilities and no indicator is 100% accurate. You find what works for you, not for the ticker you're trading.
You journal. Decipher you trade, what worked, what didn't work. You LEARN your lessons and continue to improve, just like you would for any job or hobby!
You notice you're becoming calmer when you enter trades. You have a strategy now. Take profit and Stop-loss is set ahead of entering the trade and you manage your risk as things progress.
The losses are still there but the damage they do to your portfolio and wallet are reduced. Trading is probabilities, you accept this and know that losses are natural.
You slip up. You break your rules again and suffer another sizeable loss. But journaling ingrains the pain of this into your mind. You're always going to make mistakes but the by making them less often and lower amounts you're still improving.
You have full belief in yourself. The mindset shift has occurred.
Phase 4
It's working. You've flipped into profitability and have 2 months of green in a row. Now 3, then the run ends. You've finished the month red but barely. Your risk management and mindset know this is necessary. The run starts again, green, after green, after green.
The mindset you've built carries into the rest of your life, you notice you're completely locked in and appreciate that the small improvements mean everything.
The learning continues endlessly but that's all you could ever ask for. The improvement continues endlessly but that's all you could ever ask for.
You've got the chance to build your dream life with trading. It can be the business you've dreamed of building alone or with others you've found along the way.
I myself feel like I'm still in phase 3 but edging closer and closer to phase 4. I've noticed improvements in my general life from the mindset that learning to trade has taught me.
What phase are you at and what else do you think is involved in mastery of trading?
$BTC short trade update. Position closed. Loss.
Well yesterday was a rekking ball!
TP1 of 50% was hit on Friday (14/08). TP2 & TP3 never got executed.
This week I decided to redeploy some of the profit from TP1 back into the short. I added to the short at:
- $65,400
- $66,500
While doing this I removed my SL as well and as like many other traders paid the price. This was a small account ~ $1,500 but it's been liquidated.
This is such a common theme in my own trading that I have a few good trades and then hit self-destruct on a bigger move.
Very frustrating but a lesson that I never seem to learn. I will go again but need to step back, earn some more funds to trade with and evaluate. Crypto is extremely volatile and that's what excites me about the space but maybe trading alternative markets is something to consider.
Any future trades, I'll share again but I whilst being caught on the wrong side of a $BTC move is painful, it is exciting to see the breakout from recent consolidation. Let's see how far this move can go!
For anyone else who felt pain during this move, stick at it. Practice and pain makes perfect!
$BTC short trade update.
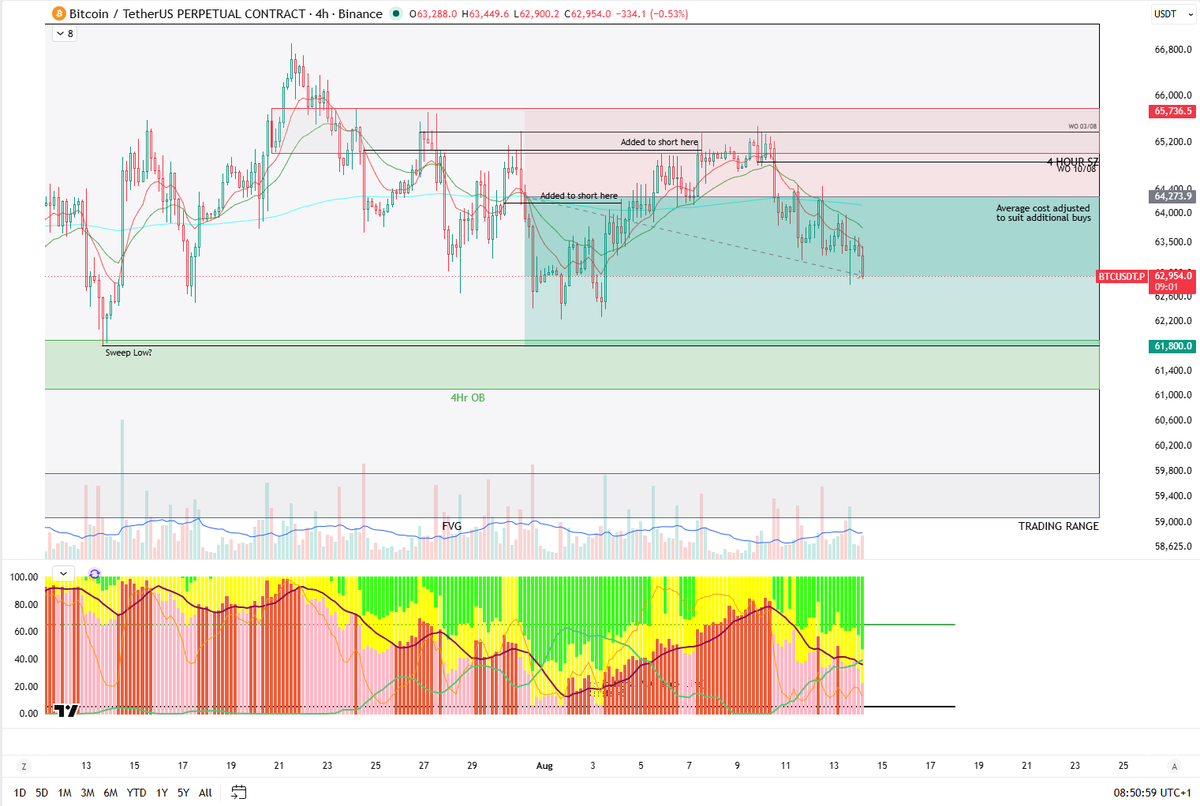
Still holding. I added on the way up to the w/o 03/08 line. This has been a slog of a trade. Unsure if we will reach the $61,800 target but best thing to do is stagger TP's.
Revised Short Plan
TP 1 @ 50% - $62,600 take 50% of the trade off.
TP 2 @ ~75% - $62,250 take a further 25% of the trade off.
TP 3 @ 100% - $61,800 target. Close trade.
$BTC short trade update.
Still holding. I added on the way up to the w/o 03/08 line. This has been a slog of a trade. Unsure if we will reach the $61,800 target but best thing to do is stagger TP's.
Revised Short Plan
TP 1 @ 50% - $62,600 take 50% of the trade off.
TP 2 @ ~75% - $62,250 take a further 25% of the trade off.
TP 3 @ 100% - $61,800 target. Close trade.
$BTC Trade Update
Long position
So I was a dumbass, closed out the entire long at $63,855 by accident. The post below shared the plan, sell 50% @ $63,855 and rebuy $BTC at $61,800. Anyway profit locked in so it's not all bad. Just over 6% trade but leveraged around 5x (so~30% win)
Short Position
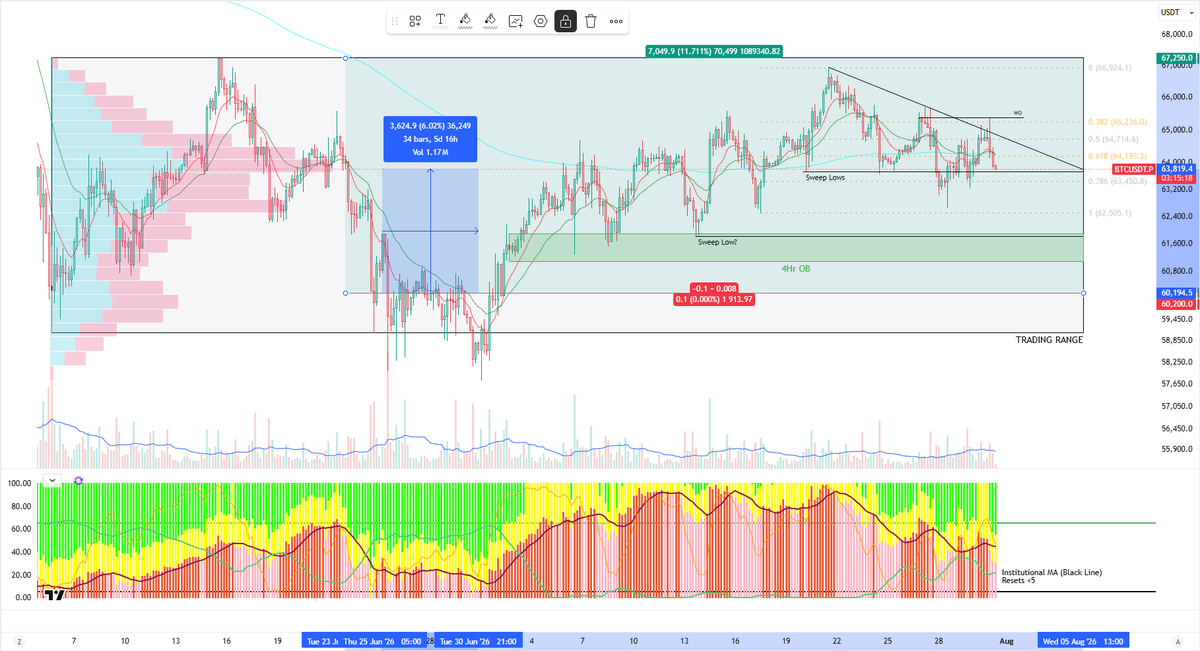
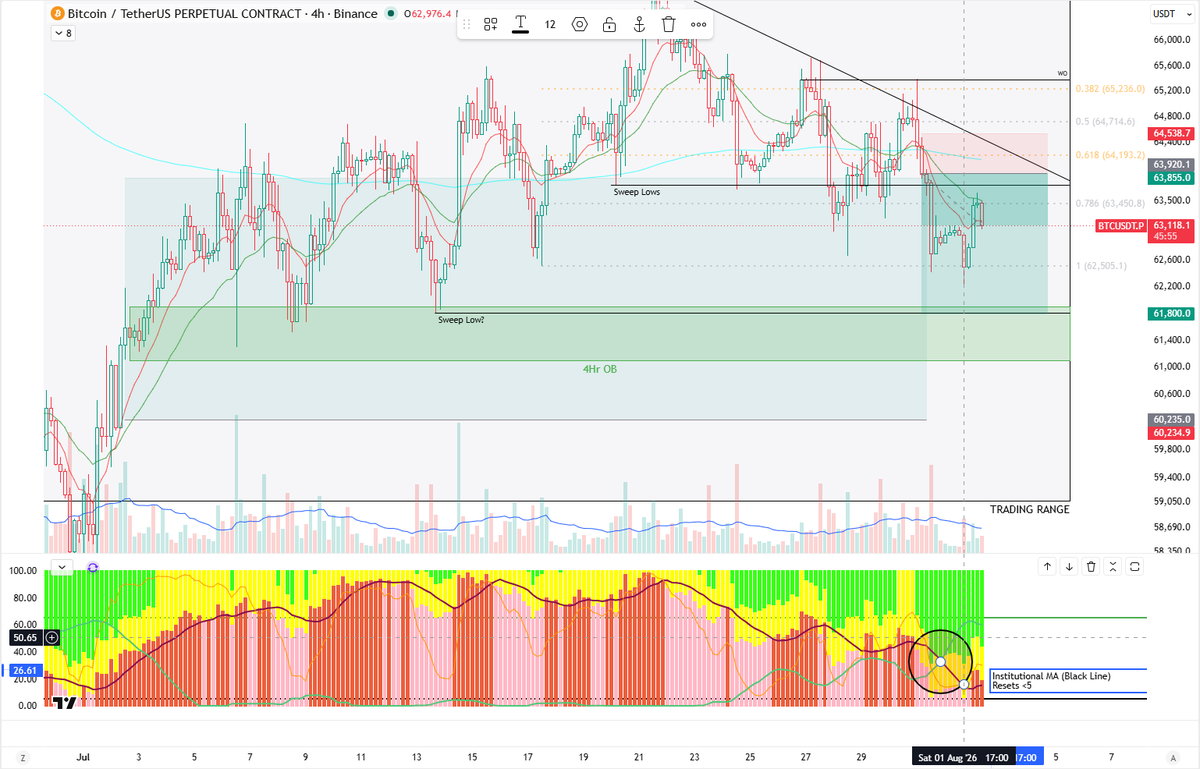
So closing the entire long position gave me extra capital to play with. Since $61,800 was the target to rebuy long my thesis was clearly short. The bearish crossover I spoke about on the MCDX indicator at the bottom of the image played out nicely - Black MA crossing below Green MA.
Opened position @ $63,920.
Take profit target @ $61,800.
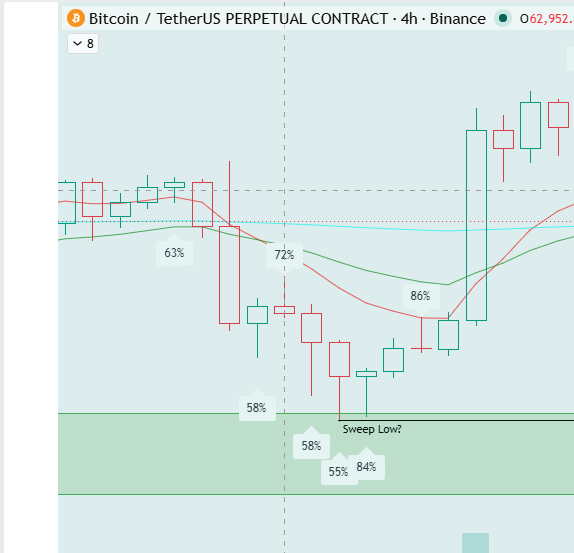
I expect the $61,800 wick labelled "sweep low?" on the chart to be hit. At that point I'll flip long again.
I'm also tempted to add to the short here as the pump towards the bottom of the descending triangle looked weak. Will monitor over the next couple hours as weekly close is coming.
$TSLA update - no trade, just monitoring.
As we expected, price bounced off the 200WEMA. A bounce from this area was predicted and here we are a couple weeks later approaching some other key weekly EMA's. I expect this bounce to stutter around $350-$380.
$250 is still the area which I would begin a position. Holding patiently for this.
$TSLA update - no trade, just monitoring.
This one moved lower FAST! Missed EPS seemed to be the root cause of the drop. So where does this end?
The bleed stopped at a key point the 200WEMA. Lower high was printed back in May, we now have a lower low as of this week. Fair chance we get a bit of relief at this level, even if it just consolidates for a while.
The range is clear. $214 being the range lows and $488.50 being range highs. This could be Wyckoff accumulation beginning to play out. A long slow grind of lower highs and lower lows back to range low? Possible, and it would cause havoc with emotions so may well be the play.
$250 is an area I like the look of to begin a position. This analysis, for now, is an unbiased take on what I see. No position, so no willing it to go back up.
$TSLA investors, what do you think comes next for the stock?
@moninvestor Interesting take. Kind of goes against the don't buy a falling knife talk for buys 1 and 2.
Not sure I agree completely with the strategy but that's what makes us all different.
@Crypto_Moe84 I got this from playing football and couldn’t shake it until I did strength work at the gym. Now it’s gone, so I’d recommend strengthening as well as the hangs from others recommendations
Got to say I've been following your $COIN analysis for a while and been trying to ignore your predictions due to my attachment to the stock. But you've nailed it so far 👏 should have saved my dry powder for the levels you've identified but it's all a learning curve.
Thanks for the analysis!
$BTC Trade Update
Long position
So I was a dumbass, closed out the entire long at $63,855 by accident. The post below shared the plan, sell 50% @ $63,855 and rebuy $BTC at $61,800. Anyway profit locked in so it's not all bad. Just over 6% trade but leveraged around 5x (so~30% win)
Short Position
So closing the entire long position gave me extra capital to play with. Since $61,800 was the target to rebuy long my thesis was clearly short. The bearish crossover I spoke about on the MCDX indicator at the bottom of the image played out nicely - Black MA crossing below Green MA.
Opened position @ $63,920.
Take profit target @ $61,800.
I expect the $61,800 wick labelled "sweep low?" on the chart to be hit. At that point I'll flip long again.
I'm also tempted to add to the short here as the pump towards the bottom of the descending triangle looked weak. Will monitor over the next couple hours as weekly close is coming.
After what people considered as the most volatile week in the markets for a while - big tech earnings, FOMC rate decision, ongoing Iran negotiations - $BTC has done dropped just shy of 2.5%.
So how does the picture for this trade look now?
The 4H chart shows a descending triangle setup with $BTC below all major EMA's. The MCDX indicator at the bottom of the screen shows the Green MA creeping closer to the Black MA. This is bearish. When the Green MA crosses above Black MA, price goes down.
We swept the lows from last Monday which I thought might push us to range high but we couldn't break above the Weekly Open (WO). We're now trending down again and I fear we may target the next lows at the top of the 4HR order block (4Hr OB), after what I noticed above.
Further indication of this is that I find candles which close red but have a lower wick greater than 45% of the overall candle length tend to indicate price will revisit that wick low. And same works in reverse for green candles FYI.
So, with that said, I think we revisit $61,800 soon and to lock in some profits, I'm going to close out 50% of the trade, keep the rest running. This allows me capital to redeploy into a long at $61,800.
Plan of attack:
Sell 50% of trade @ $63,850.
Remaining holdings average $60,250.
Rebuy @ $61,800.
Average now $61,080.71 but I'd hold more $BTC than original trade.
After what people considered as the most volatile week in the markets for a while - big tech earnings, FOMC rate decision, ongoing Iran negotiations - $BTC has done dropped just shy of 2.5%.
So how does the picture for this trade look now?
The 4H chart shows a descending triangle setup with $BTC below all major EMA's. The MCDX indicator at the bottom of the screen shows the Green MA creeping closer to the Black MA. This is bearish. When the Green MA crosses above Black MA, price goes down.
We swept the lows from last Monday which I thought might push us to range high but we couldn't break above the Weekly Open (WO). We're now trending down again and I fear we may target the next lows at the top of the 4HR order block (4Hr OB), after what I noticed above.
Further indication of this is that I find candles which close red but have a lower wick greater than 45% of the overall candle length tend to indicate price will revisit that wick low. And same works in reverse for green candles FYI.
So, with that said, I think we revisit $61,800 soon and to lock in some profits, I'm going to close out 50% of the trade, keep the rest running. This allows me capital to redeploy into a long at $61,800.
Plan of attack:
Sell 50% of trade @ $63,850.
Remaining holdings average $60,250.
Rebuy @ $61,800.
Average now $61,080.71 but I'd hold more $BTC than original trade.
$BTC trade update. The previous high support failed.
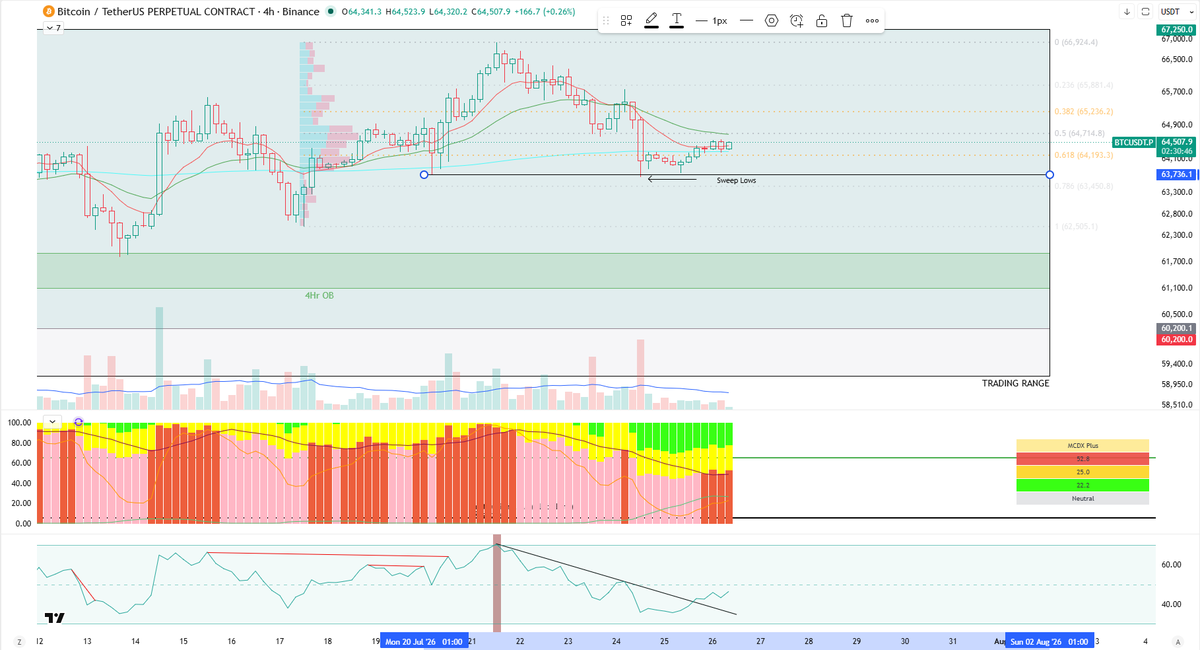
However, the good news is, based on the chart I think we've got our local bottom and the range high at $67,250 comes next.
The weekly low at $63,736.10 was swept on Friday, grabbing a load of liquidity from stop-losses being triggered. You can see the volume profile shows the cluster of orders being between this level and ~$64,900. That is the initial target to reclaim. Take back $64,900 and the push to range high happens quickly.
The 4-hour chart shows a few bullish characteristics. We retraced between the 0.618 and 0.786 on the fib, from the last higher low to higher high. We reclaimed the 4H200EMA and the RSI has broken out from a downtrend.
That's my 2 cents on the outlook, what's your thoughts?
$HOOD reported earnings last night, posting a double beat and improved numbers in most departments... excluding crypto.
Is this foreshadowing $COIN earnings after market close today? What do you think?
$TSLA update - no trade, just monitoring.
This one moved lower FAST! Missed EPS seemed to be the root cause of the drop. So where does this end?
The bleed stopped at a key point the 200WEMA. Lower high was printed back in May, we now have a lower low as of this week. Fair chance we get a bit of relief at this level, even if it just consolidates for a while.
The range is clear. $214 being the range lows and $488.50 being range highs. This could be Wyckoff accumulation beginning to play out. A long slow grind of lower highs and lower lows back to range low? Possible, and it would cause havoc with emotions so may well be the play.
$250 is an area I like the look of to begin a position. This analysis, for now, is an unbiased take on what I see. No position, so no willing it to go back up.
$TSLA investors, what do you think comes next for the stock?
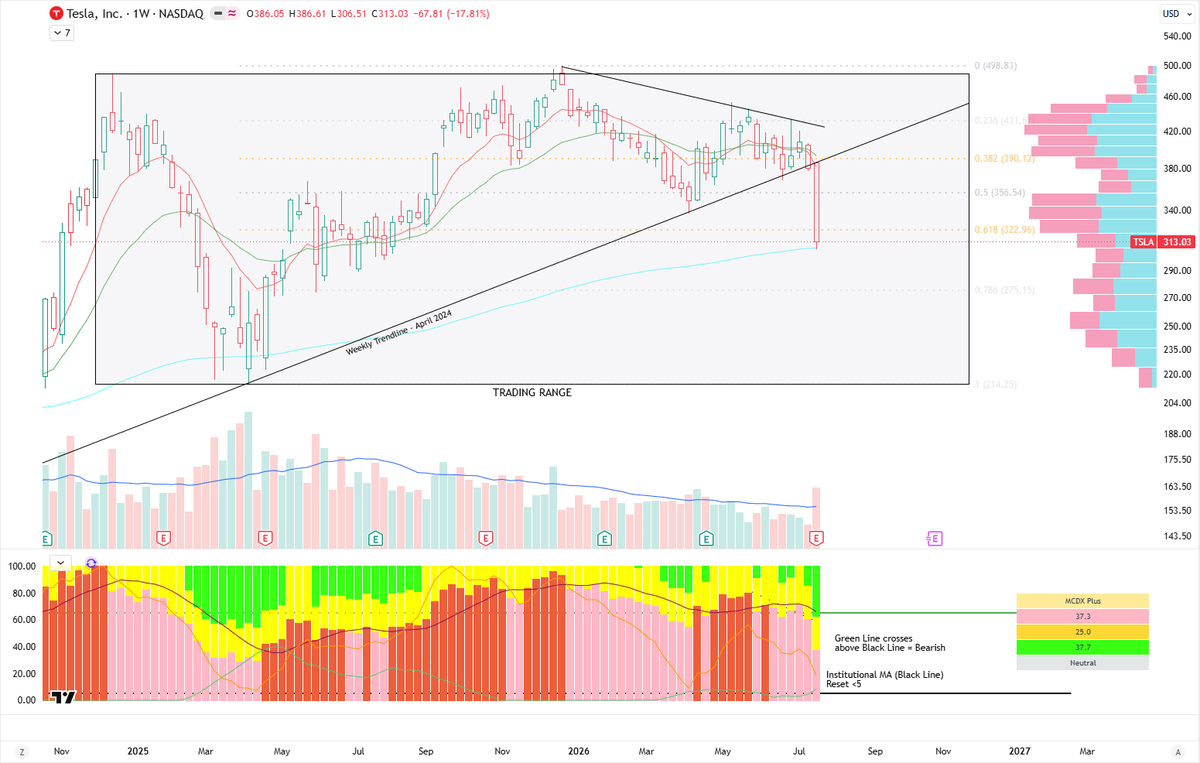
$TSLA Weekly and Daily charts are at a critical area.
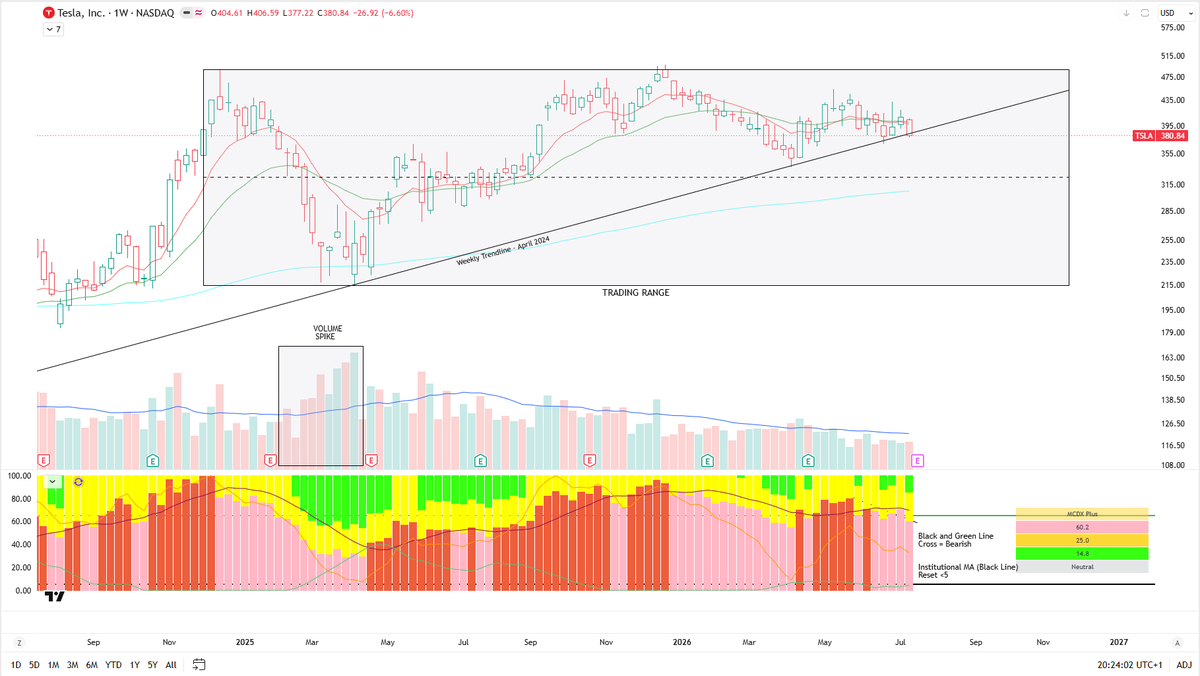
There is a clear trading range formed on the chart. Spanning from around $214 - $488.50.
On the Weekly we're at an interesting spot. Price has closed below the Weekly trendline - that's held since April 2024 - for the 1st time. Gut telling me we are pushing lower here, around $325, 200WEMA, at least.
The Daily chart doesn't paint the best picture either. There is a demand zone at $360 - $375 that could offer a short-term bounce but ultimately this goes lower for me.
Earnings next week might give us the short-term bounce but be aware of the drop to follow. It's coming. Another chance to accumulate.
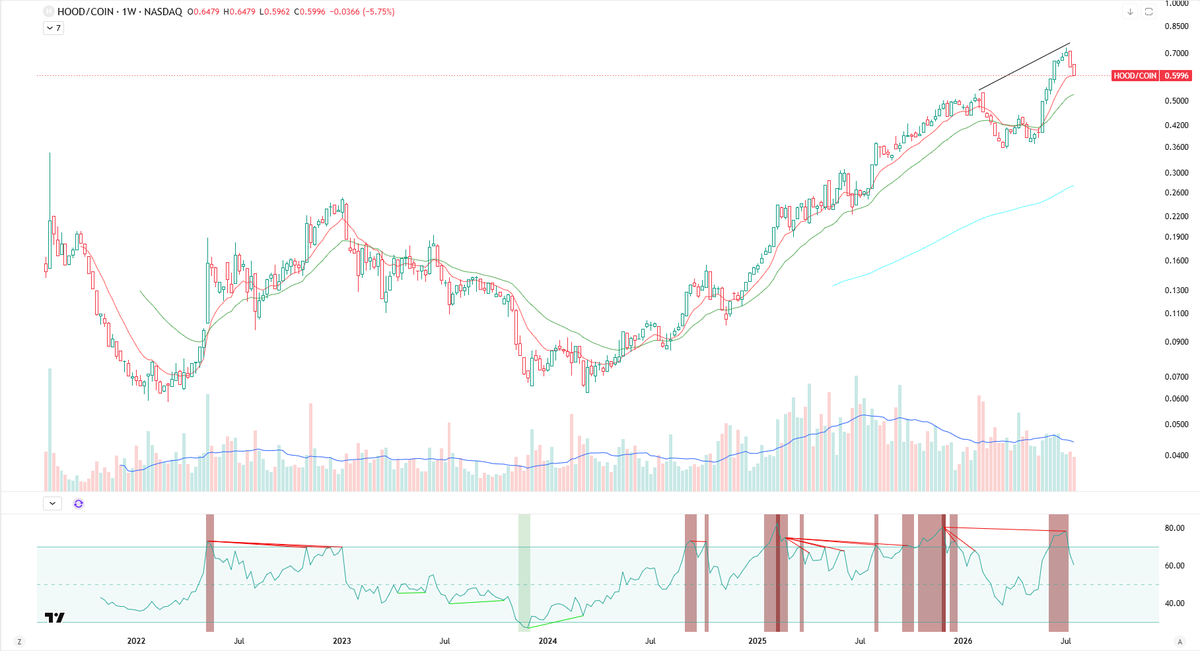
Both $HOOD and $COIN have earnings next week. $HOOD has been outperforming $COIN since early 2024.
When does this change? Or does it change? Let's see if the charts have any clues in them.
Chart 1 - $HOOD / $COIN
There is very little to suggest $HOOD's outperformance ends soon. There's compounding bearish divergences on the weekly chart but apart from that, I'm struggling to find anything worth noting.
Charts 2 & 3 - $HOOD
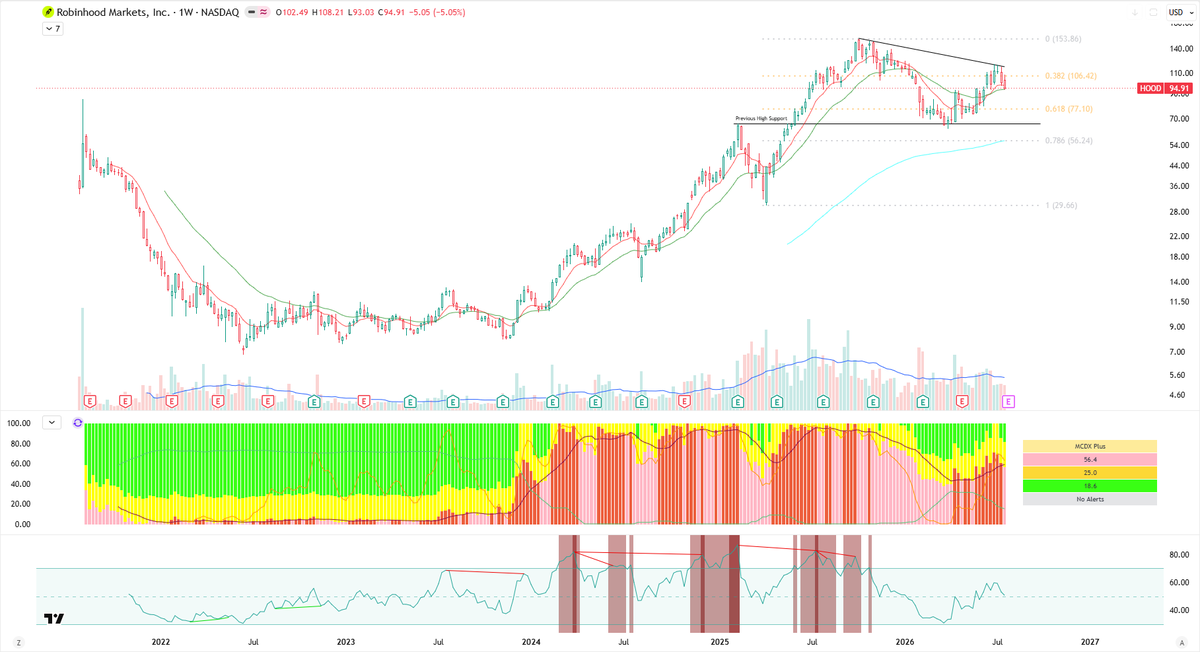
Firstly, Robinhood's run since end of 2023 has been remarkable! From ~$8 to a high of $153.86. Nuts! Now, it's taking a breather.
Weekly Chart (Chart 2) - the 200WEMA has yet to be touched. It sits around $56.25 right now and lines up nicely with the 0.786 on the fib retracement from the recent move to ATH. This seems a reasonable spot to be challenged over the next period with a possible lower high being printed recently. Reaching the 0.786 line would amount to a further 40% decline... earnings this week to be the catalyst for the drop?
Other than that the weekly isn't giving away too much right now. If we get a lower low, this chart is worth revisiting.
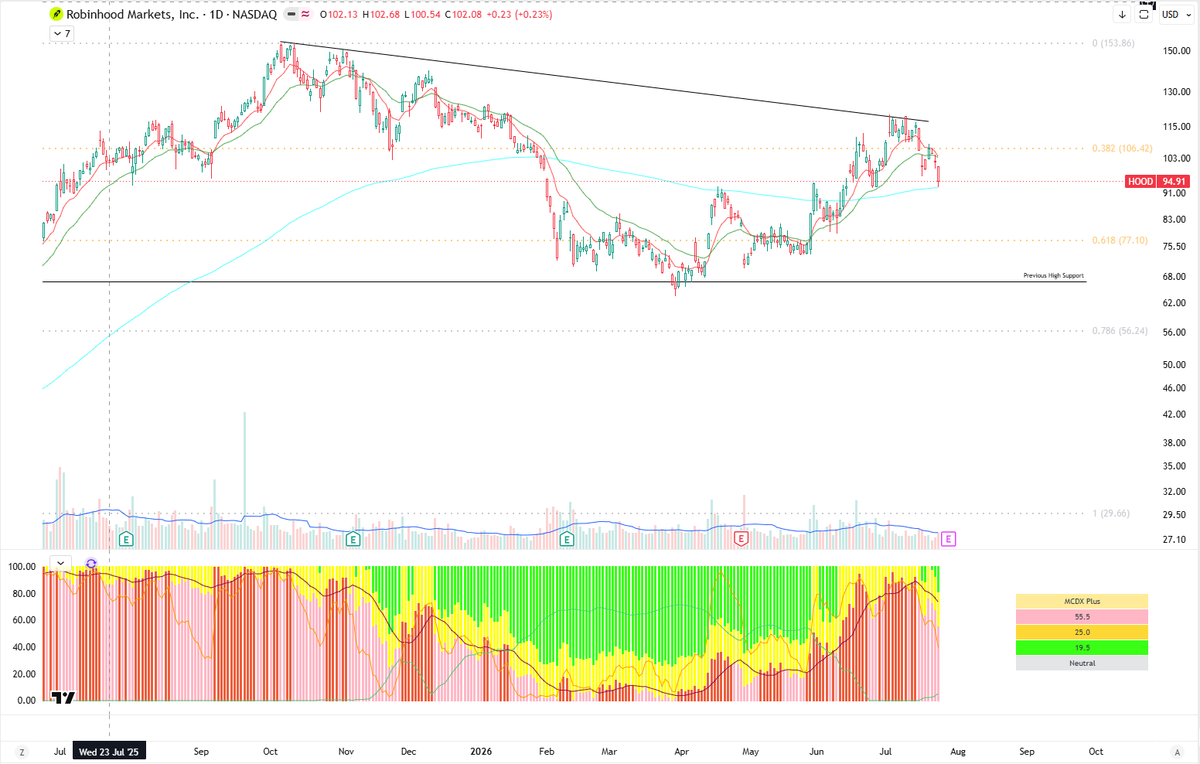
Daily Chart (Chart 3) - This paints a different picture. A series of higher highs and higher lows have been printed. Fridays wick did dip lower than the previous low but recovered to close above this level.
Coupled with the support of the 200DEMA, next weeks earnings will be a huge catalyst for a move either direction. It's hard to say where this is going but based on sentiment right now, I think we head lower. Creating a lower low and begin the descent towards the 200WEMA @ $56.25.
Chart 4 - $COIN
This is my biggest holding rn. It's been a painful hold there's no denying.
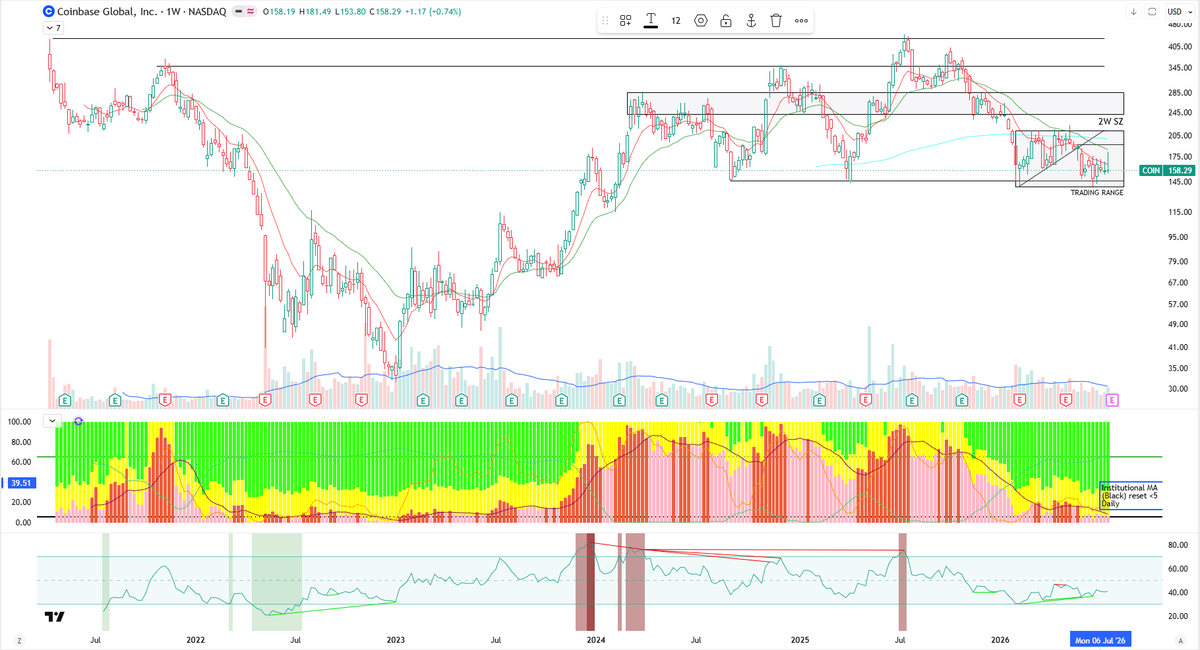
Weekly Chart (Chart 4) - Hovering around the lows which have been so fruitful over the past 2 years. What happens this time?
Positives:
- 2 bullish divergences have printed since February.
- Trading range lows are not too far away. Possible accumulation here and a wick lower might provide the spring to retest range highs - SPECULATIVE.
- MCDX indicator shows that when the institutional MA (Black MA) resets below 5, this marks a bottom. It currently sits at 8.05. A bottom is close.
Negatives:
- Crypto sentiment is low and retail participation is low. Earnings likely to be negative.
- The lows holding for a 4th time are unlikely.
- Price is below all major EMAs.
- We are 65% down from ATHs. It doesn't feel like this is over either.
The Daily chart for $COIN doesn't give away any nuggets so not going to overload this post with charts. Similar story to weekly with bullish divergences printing which is hopefully a sign for the bottom being near! HOPIUM!
$HOOD and $COIN holders, I want to know your thoughts. Reversals soon or are both heading lower? Why do you favour one over the other?
$BTC trade update. The previous high support failed.
However, the good news is, based on the chart I think we've got our local bottom and the range high at $67,250 comes next.
The weekly low at $63,736.10 was swept on Friday, grabbing a load of liquidity from stop-losses being triggered. You can see the volume profile shows the cluster of orders being between this level and ~$64,900. That is the initial target to reclaim. Take back $64,900 and the push to range high happens quickly.
The 4-hour chart shows a few bullish characteristics. We retraced between the 0.618 and 0.786 on the fib, from the last higher low to higher high. We reclaimed the 4H200EMA and the RSI has broken out from a downtrend.
That's my 2 cents on the outlook, what's your thoughts?
Still holding on for the top of the range to be hit at $67,250.
$BTC making a series of higher highs and higher lows. With the last high potentially now flipping to support along with the 4H20EMA.
Patience here.
@SunriseTrader What were your thoughts on exiting $COIN here? Some bullish activity on the longer-time-frame charts, weekly bullish divergence, and the daily printing higher highs and higher lows.
$BTC is showing some similar patterns too. Just curious to know
Still holding on for the top of the range to be hit at $67,250.
$BTC making a series of higher highs and higher lows. With the last high potentially now flipping to support along with the 4H20EMA.
Patience here.
$BTC is going for the range highs.
Since early June $BTC has been chopping and consolidating within a range from around $59,000 - $67,250.
Flipping previous resistance and the MA's shown into support is what we've needed to see.
Early next week the range high will be retested at $67,250. Patiently waiting for the Trump Sunday night tweet to pump the market ahead of NY open and reach TP.
At $67,250 I'll close this current trade - been in since $60,200 and see what developments occur next week.