La FIFA acaba de autorizar la tarjeta naranja, que junto con la amarilla y la roja funcionará para expulsar y luego quitar la sanción según sea el gusto del líder autoritario en turno.
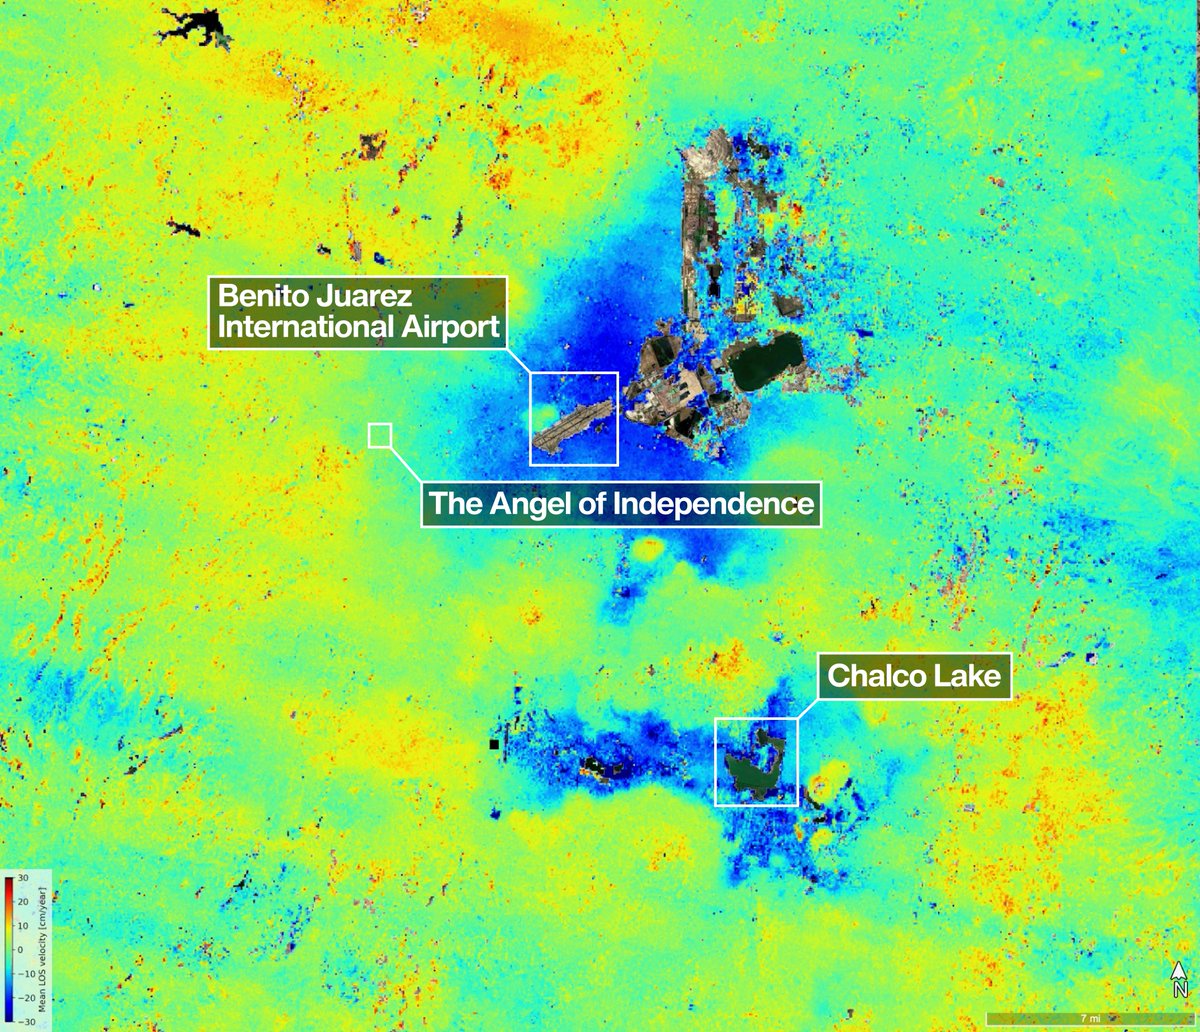
The ground beneath Mexico City is slowly sinking, and now, the NISAR satellite can track it from space.
New data shows parts of the city (in blue) that sank more than half an inch (more than 2 cm) per month from Oct. 2025 to Jan. 2026.
@DavidFaitelson_ Es notorio que Faitelson, no ha estado en marchas, mítines, movilizaciones masivas, etc, salvo partidos de fútbol. Quizás por eso crea que los estadios son una "oportunidad liberal y democrática"
@Piniisima Quizás porque está plataforma ya no tiene el peso político de antes. Desde que Elon Musk adquirió X, la plataforma es una caja de eco de las posturas de extrema derecha.
Automating report creation can save a significant amount of time, especially when reports need to be updated regularly (e.g. monthly or yearly).
A very useful tool for this is Quarto in R. It is a modern publishing system that allows you to combine text, code, and results in a single document. Your R code is executed directly inside the document, and outputs such as tables, figures, and summaries are automatically included in the final report. You can also choose the output format, for example HTML, PDF, or DOCX.
If you are creating the same report repeatedly, you simply update the input data and run the Quarto document again. That’s it.
I recently released a new module in the Statistics Globe Hub that focuses on creating reports with Quarto in R. The module includes a video lecture, hands-on examples, and exercises to guide you through building reproducible reports step by step.
Not a Statistics Globe Hub member yet? The Hub is an ongoing program with a new module released every week, covering topics in statistics, data science, AI, R, and Python.
Join the Hub now to get access to the Quarto module along with all other modules released this month.
More information about the Statistics Globe Hub: https://t.co/NA2b7UAXJ4
#rstats #datascience #statistics #quarto #reporting #reproducibility #statisticsglobehub
Still time to join our #MetaAnalysis in R course with @ASanchez_Tojar & @shreya_dimri_ (11–14 May, online)!
Learn systematic reviews, effect sizes, meta-analysis & meta-regression in R with hands-on exercises & real datasets.
https://t.co/GU2MbRNb9Z
#RStats
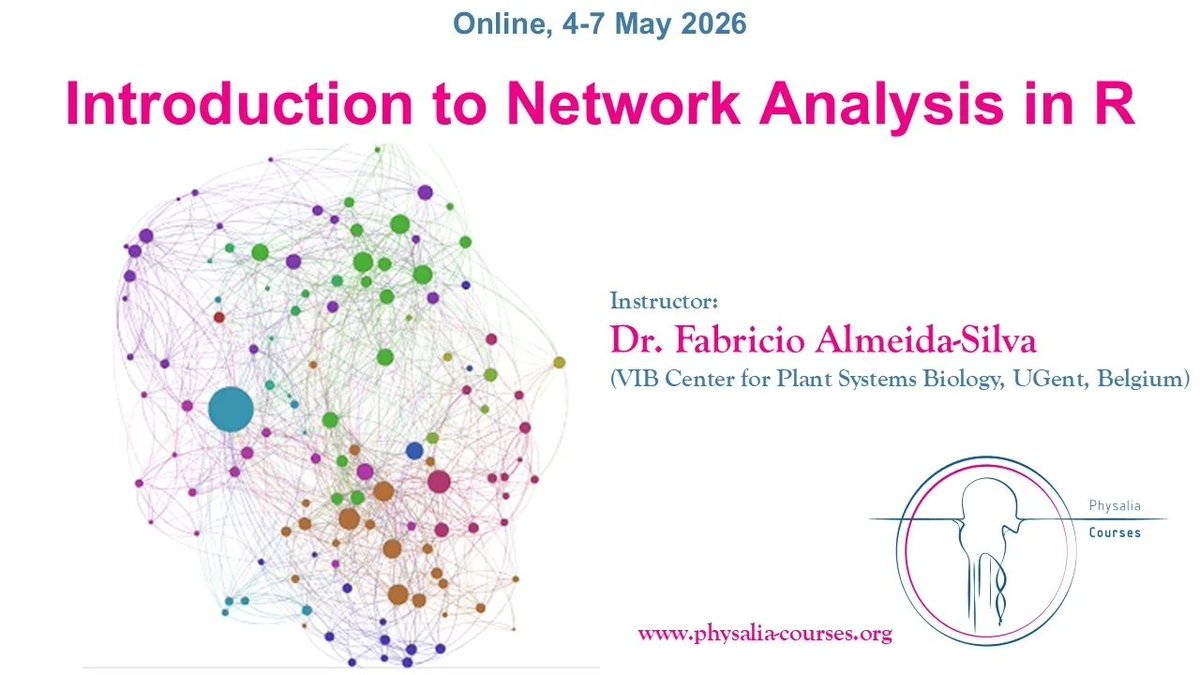
Excited to announce our Network Analysis in R course
(4–7 May)! Learn to create, analyse & visualize networks in R with hands-on coding.
#NetworkAnalysis#Rstats
https://t.co/YmgnJmJocN
@AmerangelLorenz Si la diputada ignora el grave problema del bloqueo económico contra Cuba desde hace 60 años, se podría entender que la diputada no lee antes de postear. Pero si lo sabe, y apesar de eso lo postea, ya estamos hablando del uso de la mentira para manipular personas sensibles.
La guerra entre Afganistán y Pakistán es solo un distractor para que China no intervenga militarmente en Irán, si tiene un conflicto en su frontera sur.
Publicado en 1848 por Karl Marx y Friedrich Engels, este texto propone una nueva organización social y económica y es un referente para el análisis del pensamiento político. ➡️1/2
@RepCarlos The January incident involved the kidnapping of a sitting president, which is illegal, and the cases have been watered down, so that such action will remain a mere theatrical performance. In the February case, it was an action carried out by the Mexican army, not by Trump.
@EmmaRincon Un paso clave entre la infancia y la madurez es aprender a diferenciar entre las caricaturas y el mundo real. Los memes son caricaturas, tomar acciones y generar información a partir de caricaturas (ideaciones o sesgos subjetivos) no es darle seriedad a lo que se dice.