Power BI, data storytelling, and visual analytics — and I’m truly proud of how far I’ve come. 🚀 Special thanks to AMDOR ANALYTICS for the platform and to others who joined in the class.
Day 63 & 64 of 90days
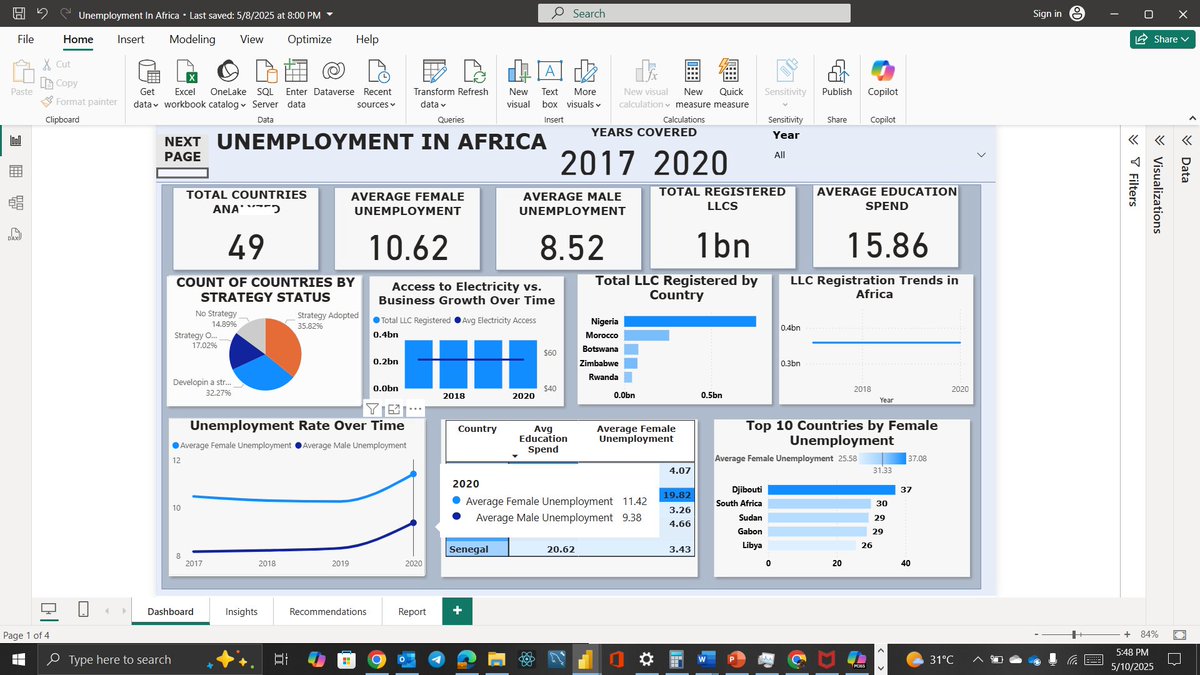
DATA INSIGHTS | UNEMPLOYMENT IN AFRICA (2017–2020)
Over the past few weeks, I’ve been working on a data analytics Capstone Project examining unemployment trends across 49 African countries. With data covering 2017–2020, I explored factors like gender
ial efforts across the continent. 🎤 I had the privilege of presenting this project today, and I received lots of insightful feedback and helpful corrections from industry professionals and peers. It was both humbling and empowering. This project allowed me to deepen my skills in
Namibia, and Ethiopia stood out for their contrasting education and unemployment dynamics Djibouti and South Africa recorded the highest female unemployment rates One surprising trend? Despite rising unemployment, LLC registrations grew steadily, suggesting a rise in entrepreneur
strategic impact Countries with no clear strategy or underdeveloped plans tend to show poorer unemployment outcomes 1 billion LLCs were registered during this period, with Nigeria leading the way A clear link emerged between access to electricity and business growth Sierra Leone,
Day 64 of 90 : Learning, Unlearning, and Relearning — the Power of Growth
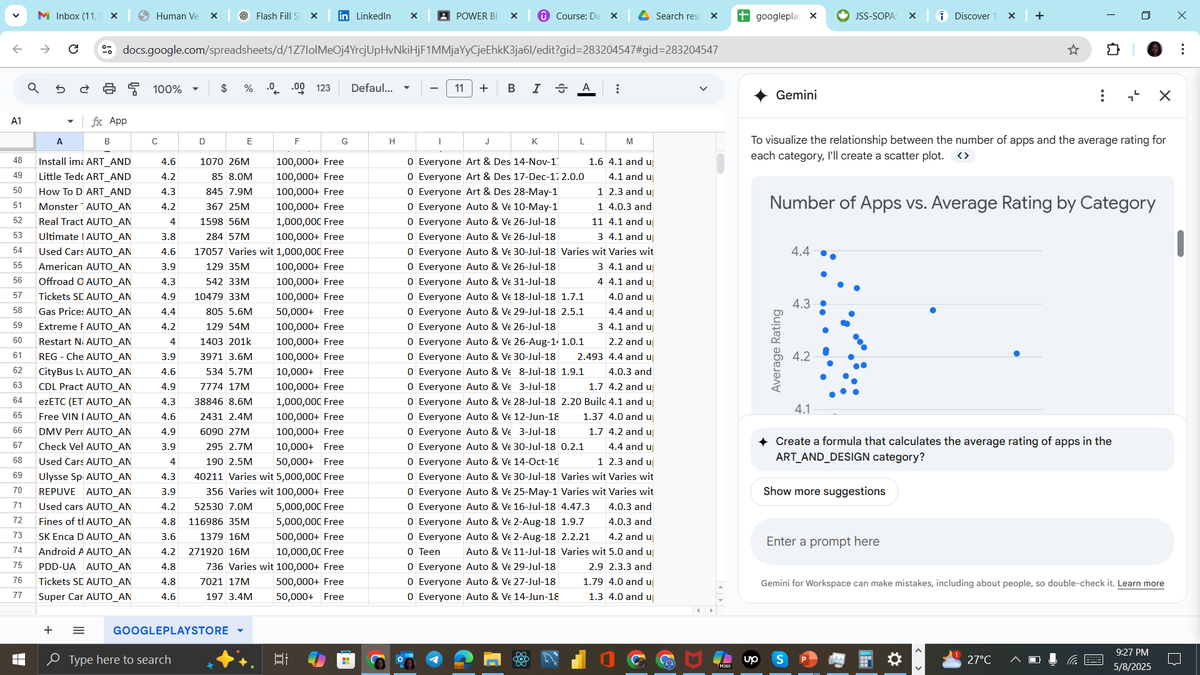
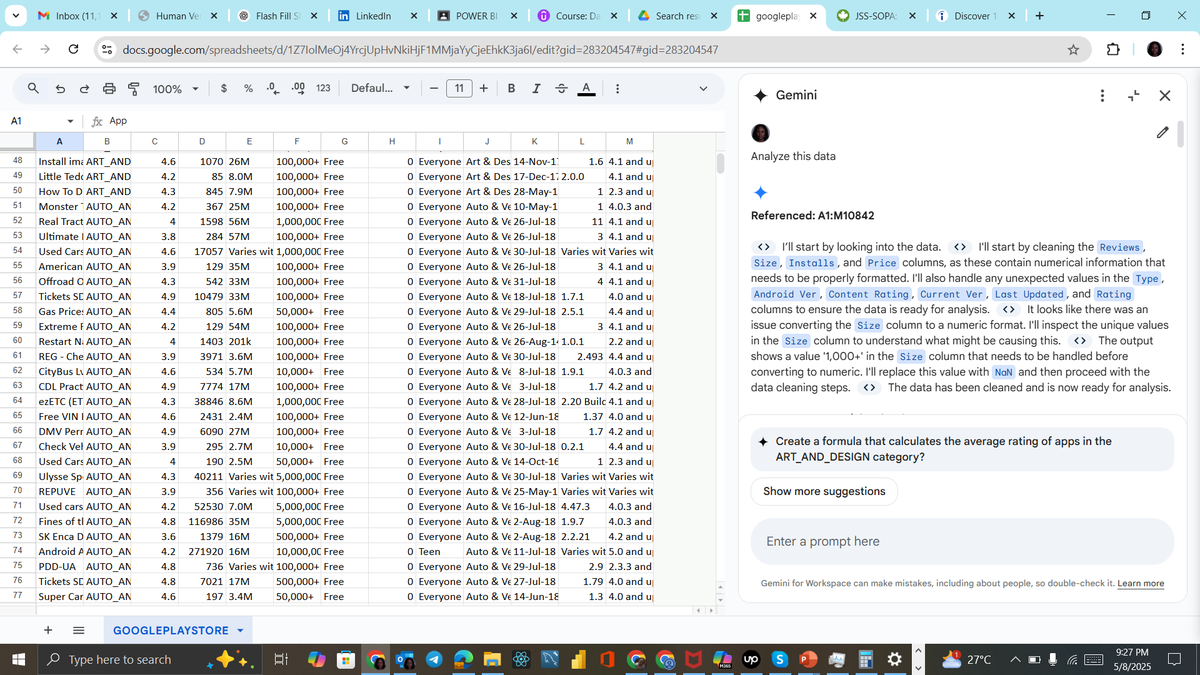
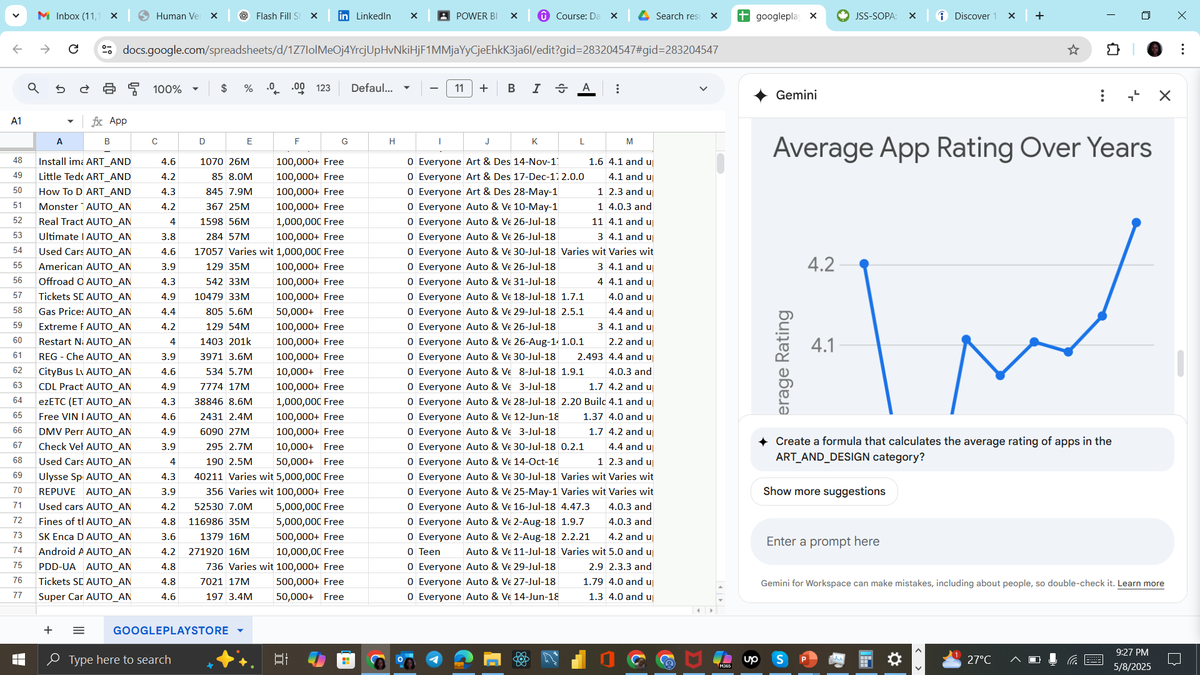
Today, while clearing out my Google Drive, I stumbled on a dataset I must have saved two years ago during my Google Data Analytics program!
Curious, I clicked on a prompt that said “Analyze the data,” and
currently learning with AMDOR ANALYTICS, everything made sense.
Sometimes, growth doesn’t announce itself loudly.
It shows up when something that once confused you becomes crystal clear.
The AI was smart, but what mattered more was that I had grown smarter too.
#DataAnalytics
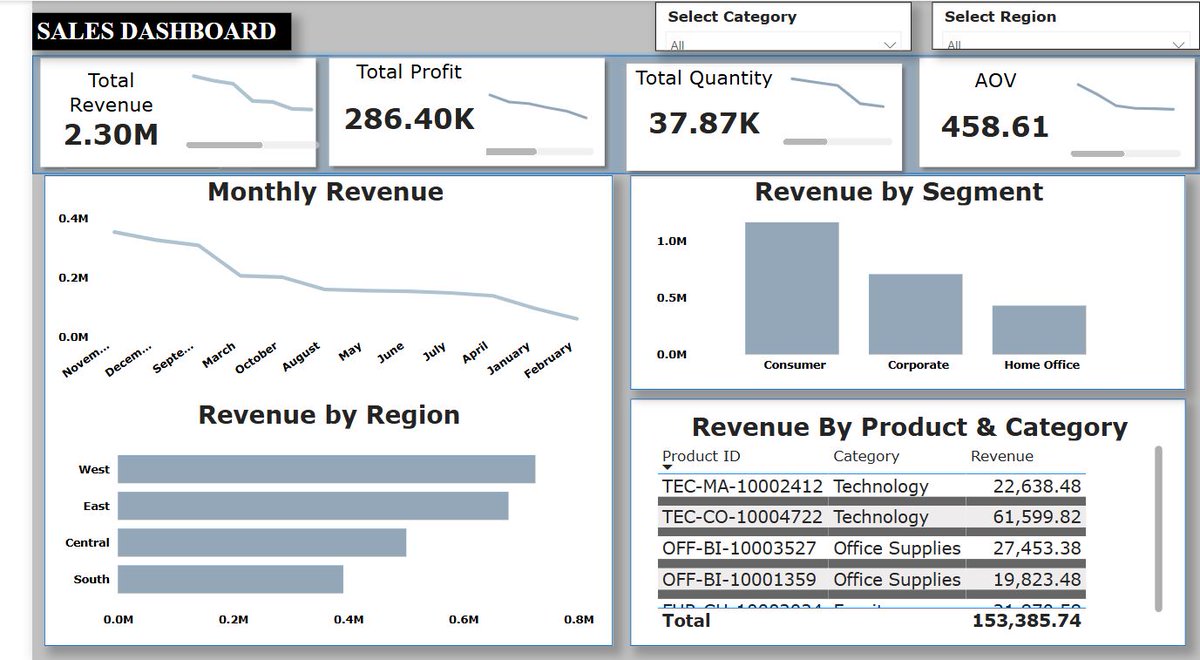
Sales Performance at a Glance!
Here's a Sales Dashboard built with Power BI 🔥:
✅ Total Sales across 3 branches
✅ Best Performing Branch Highlighted
✅ Sales Breakdown by Product Category
✅ Monthly Sales Trend Analysis
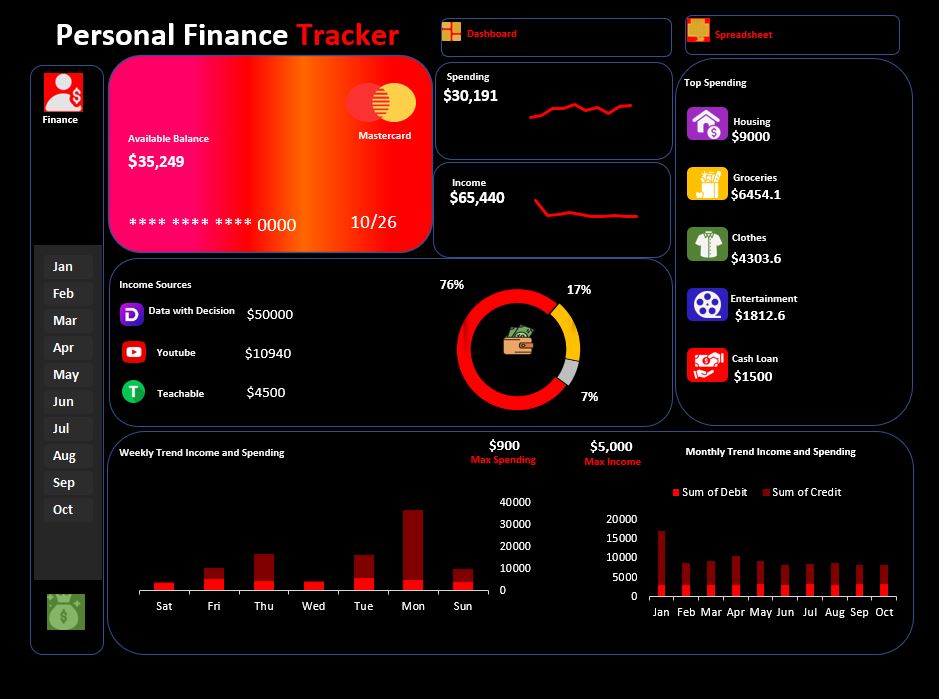
Here’s the gist:
💳 Balance: $35,249
📈 Income: $65,440
📉 Spending: $30,191
🏡 Biggest spend = Housing ($9K!)
🍽️ Groceries + Clothes also eating good chunks 🍕
Tracking helps you stay in control of your finances! #PowerBI#FinanceDashboard#DataAnalytics
Hi everyone, So I have been off and on the data journey due to reasons beyond my control. This year I officially started afresh and I decided to share one of my projects I worked on last week. It was a trend i found on linkedin and I also jumped on it.
🔥 Join the $1,500 $TON Deposit Campaign! 🔥
Increase your crypto assets and claim a share of the $1,500 #TON prize pool!
Campaign Details 🏆
Prize Pool: $1,500 $TON
Duration: March 26 – April 22
Rewards Distribution: April 24
Deposit at least 1 TON in #SpellWallet and hold it throughout the campaign.
How to Join? 🎉
1️⃣ Open the app:
https://t.co/oRq8UFl99b
2️⃣ Go to the “Quests” tab
3️⃣ Deposit from 1 $TON and hold until the end of the campaign
Act quickly to secure your share before the campaign ends — April 22nd!