BREAKING NEWS 🔥 STOCK MARKET PARTICIPANTS!
RBI raises policy repo rate by 25 basis points to 5.50 per cent as August CPI inflation hits 4.8 per cent
India's CPI inflation rose to 4.8 per cent in August, the third consecutive month above the Reserve Bank of India's 4 per cent target, prompting the Monetary Policy Committee to raise the policy repo rate by 25 basis points to 5.50 per cent and adopt a calibrated tightening stance. The RBI raised its baseline CPI inflation forecast for 2026-27 to 5.2 per cent. Governor Sanjay Malhotra said headline inflation is expected to average almost 5.8 per cent in the next three quarters, citing global energy shocks and monsoon disruptions.
Yesterday, Nifty50 gained 0.60% but the Advance/Decline ratio was weak at 0.77
Today however, things seems to be improving. A/D ratio jumped to 2.4. Means, for every declining stock, 2.4 stocks gained (average)
More stocks took part in the rise Though, most stocks still remain at or below their moving averages.
Some data from today -
# Nifty gained 0.98%.
# NSE recorded 1,806 advances and 751 declines.
# The median stock return increased from −0.33% to +0.91%.
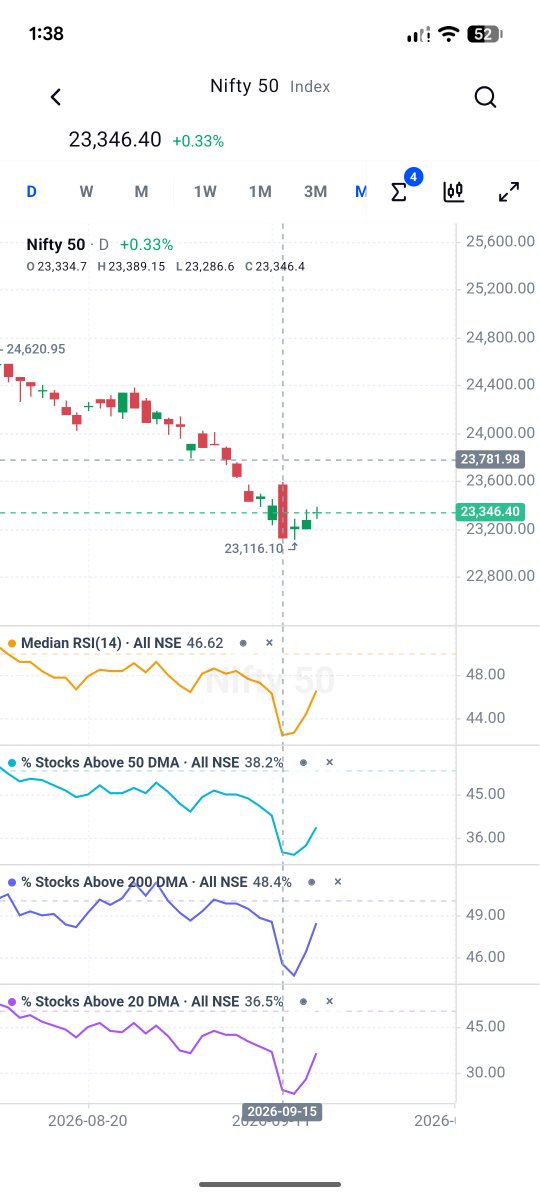
# Stocks above the 20-DMA increased from 23.8% to 32.1%.
# The shares above the 200-DMA increased from 42.5% to 44.3%.
# Among the 50 Nifty members, only 10 are above their 20-DMA.
# Nifty itself remains 6.34% below its 200-DMA.
# New 52-week lows still exceeded new highs: 53 against 51.
I also checked earlier periods with breadth at the current level or weaker.
After 20 sessions, Nifty finished higher in 12 of 15 completed cases.
The average return was +1.25%.
After 60 sessions, the average return was +0.98% across 14 completed cases.
Across all valid days, the 60-session average was +3.07%.
Today, more stocks rose. A stronger trend still needs more stocks to stay above their averages.
Next, watch whether the share above the 20-DMA keeps increasing and new 52-week highs exceed new lows.
57.5% of covered NSE stocks are at or below their 200-DMA.
That is 1,293 stocks out of 2,249.
Nifty is also 7.3% below its own 200-DMA.
Does this mean a recovery is near?
I checked more than 10 years of daily data.
After 14 similar historical entries, Nifty was higher in 11 cases after 20 trading sessions.
Its average return was +1.21%.
But the result changed over 60 sessions.
Only 7 of the 14 cases ended higher.
The average return was just +0.06%.
For comparison, Nifty’s average 60-session return across all valid days was +3.07%.
The July case shows why this matters.
On 8 July 2026, 57.8% of covered stocks were at or below their 200-DMA.
Nifty increased by 3.1% over the next 20 sessions.
After 60 sessions, it was 6.1% below its starting value.
The early increase did not continue.
Over 120 sessions, 9 of 13 completed cases ended higher.
The average return was +4.41%.
I also checked how often this level of weakness occurred.
It appeared on 36% of valid days since 2016.
The sample is small, and stock coverage changes over time.
The results also change when nearby entries are grouped differently.
A short increase can occur while many stocks remain weak.
That increase alone does not confirm a market recovery.
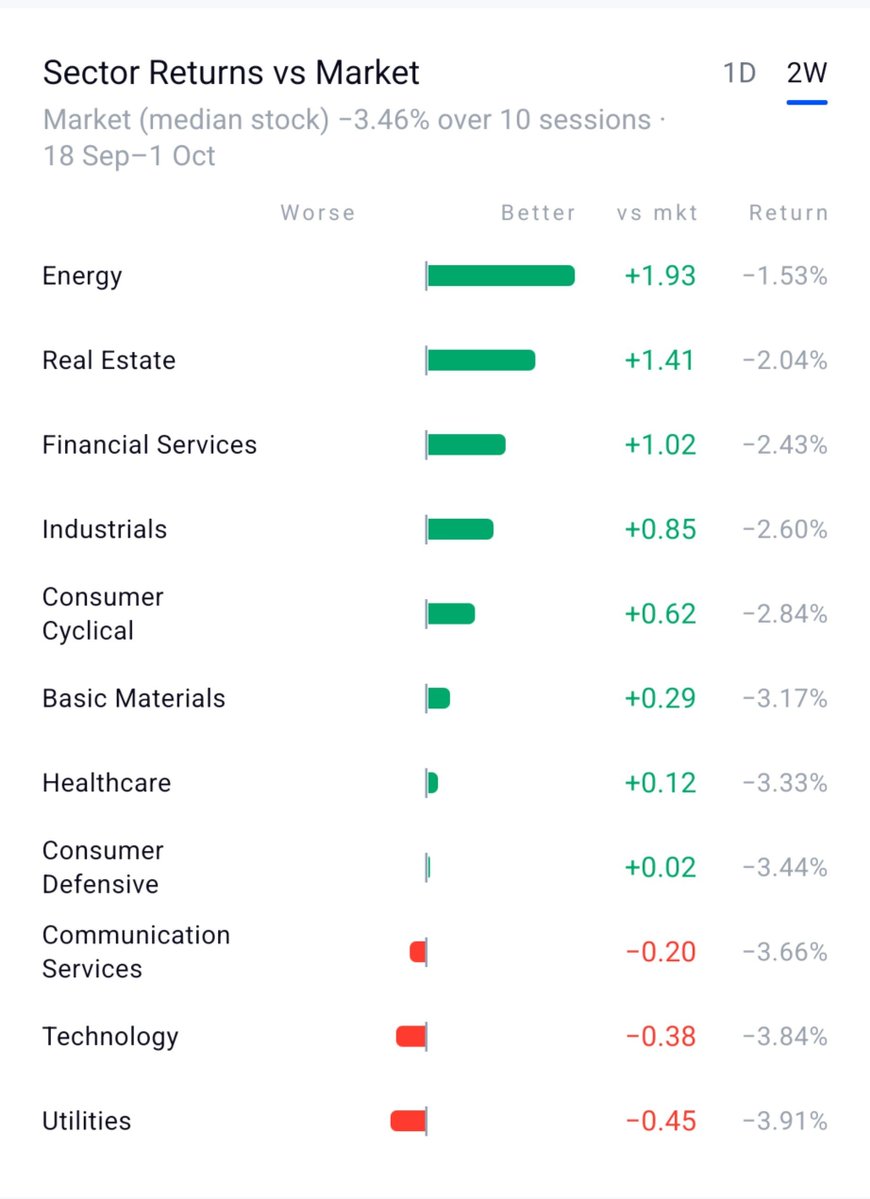
The market fell 3.46% in 10 sessions.
But all sectors did not move the same way.
• Energy was +1.93% better than the market.
• Real Estate was +1.41% better.
• Financial Services was +1.02% better.
• Technology and Utilities were weaker than the market.
This difference is important.
When the market falls, some sectors can start to show relative strength before the index recovers.
Which sector will lead the next move?
#sectorRotation #stockMarket
#Indices #nifty50
@thsottiaux@grok make benchmark charts comparing 5.6 luna vs 6 luna (in all thinking modes) and also 5.6 sol vs gpt 6 sol.
Terminal bench 4.0 and all other major benchmarks.
@ARanganathan72 Imagine an education system where students will cheat, and teachers will fear catching students as they may get cancelled.
Concerning. @grok what do you think?
Market breadth - Stocks above 50, 200 , 20 period DMA, and median RSI is also taking a halt. Historical, when this happens, Index takes a stall/retracement.
Within the next 20 sessions:
• 95.5% saw at least a 1% rebound
• 82.1% saw at least a 2% rebound
• 44.8% saw at least a 5% rebound
You can check full tweet here
Another interesting result 2,885-session Nifty50 and median RSI study.
What actually happens after the whole market gets overbought or oversold?
We looked at median RSI(14) across NSE stocks then tracked whether Nifty simply retraced or actually changed trend.
MEDIAN RSI : WHAT RSI value most stocks on NSE is trading at.
When median RSI fell below 40, there were 67 separate episodes.
Within the next 20 sessions:
• 95.5% saw at least a 1% rebound
• 82.1% saw at least a 2% rebound
• 44.8% saw at least a 5% rebound
But here’s the important part:
Only 53.7% eventually became a proper structural trend change.
The rest were temporary rebounds or consolidation.
So “market oversold” was very good at identifying areas where some rebound was likely, but it did NOT mean the bottom was already in.
2020 is the obvious example: median RSI became extremely low while Nifty was still falling.
The opposite side was even more interesting.
When median RSI went above 60, there were 26 episodes.
Within 20 sessions:
• 84.6% saw at least a 1% pullback
• 57.7% saw at least a 2% pullback
• 38.5% saw at least a 5% pullback
Yet only 23.1% turned into a structural bearish trend change.
So high market-wide RSI was much worse at calling a top than low RSI was at identifying a recovery zone.
Simple takeaway:
Low RSI → rebound is common, but wait for confirmation.
High RSI → some pullback is common, but strong markets can stay strong.
And currently?
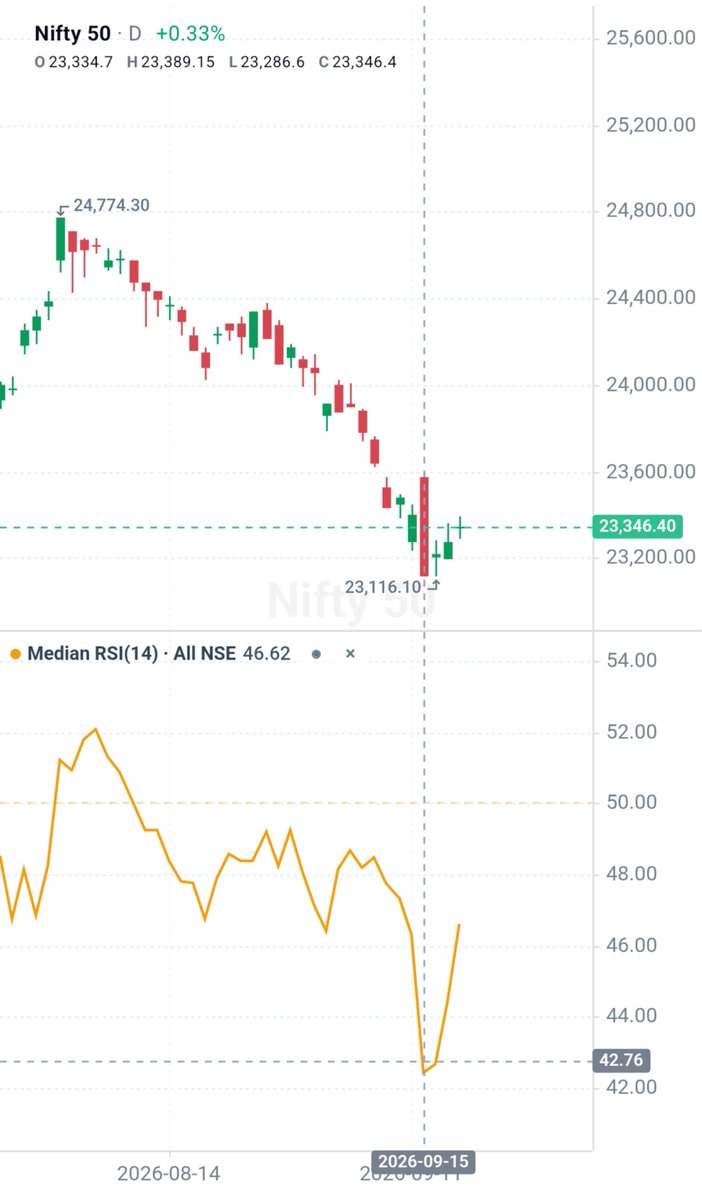
Median NSE RSI: 46.62
Nifty RSI: 33.67
Advancing stocks: 64.94%
So despite weak Nifty, the broader market itself is nowhere near a median-RSI extreme right now.
#nifty50 #market #StockMarketNews #godmorningsaturday
Jev and I analysed 2,885 Nifty trading sessions from Jan 2015 to 18 Sep 2026 using the median RSI(14) of all NSE stocks.
One thing stood out:
A low market-wide RSI by itself was not a great “buy the dip” signal.
When median RSI fell below 40, Nifty’s average return over the next 20 sessions was +1.08%.
But when median RSI first fell below 40 and then recovered back above 40:
• 67 historical events
• Avg 20-session return: +1.60%
• Positive 20-session return: 62.7%
And when that recovery happened with Nifty RSI already above 45:
• 24 events
• Avg 20-session return: +2.50%
• Positive return rate: 70.8%
So the interesting part wasn’t “oversold”.
It was the recovery from oversold.
Another interesting divergence:
Median RSI ≤40 while Nifty RSI stayed above 40 → 79.2% of the 24 historical cases had a positive 20-session return.
Now, as of 18 Sep:
Median NSE RSI: 46.62
Nifty RSI: 33.67
Advancing stocks: 64.94%
McClellan: +7.66
Nifty: below 200 DMA
So right now, the index itself is weak, but the broader market is holding up relatively well.
This is not a classic market-wide oversold setup.
The bigger takeaway from the full study: median market RSI seems far more useful as a market-state indicator than a standalone buy/sell signal.
Its correlation with the next 20-session Nifty return was basically zero (-0.005).
Another interesting result 2,885-session Nifty50 and median RSI study.
What actually happens after the whole market gets overbought or oversold?
We looked at median RSI(14) across NSE stocks then tracked whether Nifty simply retraced or actually changed trend.
MEDIAN RSI : WHAT RSI value most stocks on NSE is trading at.
When median RSI fell below 40, there were 67 separate episodes.
Within the next 20 sessions:
• 95.5% saw at least a 1% rebound
• 82.1% saw at least a 2% rebound
• 44.8% saw at least a 5% rebound
But here’s the important part:
Only 53.7% eventually became a proper structural trend change.
The rest were temporary rebounds or consolidation.
So “market oversold” was very good at identifying areas where some rebound was likely, but it did NOT mean the bottom was already in.
2020 is the obvious example: median RSI became extremely low while Nifty was still falling.
The opposite side was even more interesting.
When median RSI went above 60, there were 26 episodes.
Within 20 sessions:
• 84.6% saw at least a 1% pullback
• 57.7% saw at least a 2% pullback
• 38.5% saw at least a 5% pullback
Yet only 23.1% turned into a structural bearish trend change.
So high market-wide RSI was much worse at calling a top than low RSI was at identifying a recovery zone.
Simple takeaway:
Low RSI → rebound is common, but wait for confirmation.
High RSI → some pullback is common, but strong markets can stay strong.
And currently?
Median NSE RSI: 46.62
Nifty RSI: 33.67
Advancing stocks: 64.94%
So despite weak Nifty, the broader market itself is nowhere near a median-RSI extreme right now.
#nifty50 #market #StockMarketNews #godmorningsaturday
Jev and I analysed 2,885 Nifty trading sessions from Jan 2015 to 18 Sep 2026 using the median RSI(14) of all NSE stocks.
One thing stood out:
A low market-wide RSI by itself was not a great “buy the dip” signal.
When median RSI fell below 40, Nifty’s average return over the next 20 sessions was +1.08%.
But when median RSI first fell below 40 and then recovered back above 40:
• 67 historical events
• Avg 20-session return: +1.60%
• Positive 20-session return: 62.7%
And when that recovery happened with Nifty RSI already above 45:
• 24 events
• Avg 20-session return: +2.50%
• Positive return rate: 70.8%
So the interesting part wasn’t “oversold”.
It was the recovery from oversold.
Another interesting divergence:
Median RSI ≤40 while Nifty RSI stayed above 40 → 79.2% of the 24 historical cases had a positive 20-session return.
Now, as of 18 Sep:
Median NSE RSI: 46.62
Nifty RSI: 33.67
Advancing stocks: 64.94%
McClellan: +7.66
Nifty: below 200 DMA
So right now, the index itself is weak, but the broader market is holding up relatively well.
This is not a classic market-wide oversold setup.
The bigger takeaway from the full study: median market RSI seems far more useful as a market-state indicator than a standalone buy/sell signal.
Its correlation with the next 20-session Nifty return was basically zero (-0.005).
@gocharting Only before corona traders/investors know how essential this flatform was. Go charting was default for eveey broker before tradingview
❤️ Go charting will stay forever