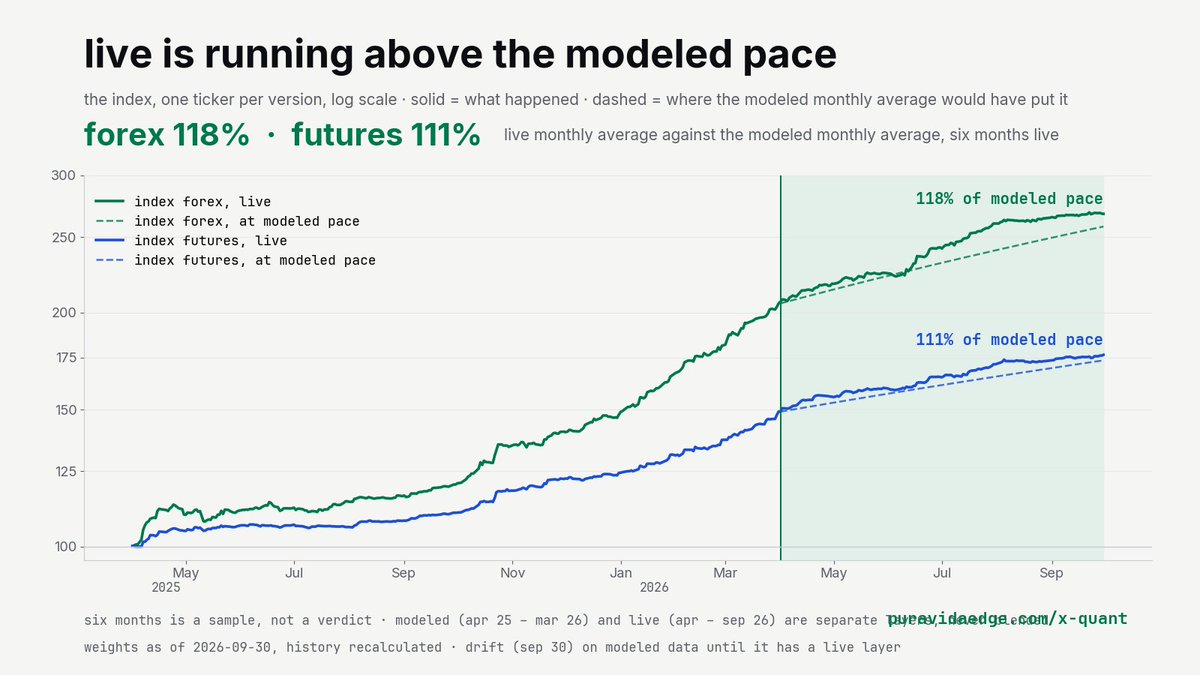
six months of live results on the index now sit above the modeled pace: 118% on the forex version, 111% on futures. full numbers, both versions, every month: https://t.co/bcRlcGspRq
the index is a full set of strategies on one prop account, read as a ticker: 100 on april 1, 2025, plus cumulative net as a percent of account size. forex reads 267.81 on a 100k account, futures 176.38 on 150k. two versions, never added together.
the pace number is one division: live monthly average over modeled monthly average. the normal direction of that arrow is down. costs get modelled optimistically, fills happen at prices the tester assumed away, and the person running it starts adjusting. so an arrow pointing up needs a reason that can be checked rather than admired.
what the logs show is that nothing was adjusted. every strategy is sized by its own volatility and capped at what it would carry alone, the weights get recalculated every quarter from volatility and never from last quarter's results, and no strategy got paused for a bad month. that removes the largest single source of live underperformance, which is the person watching.
the caveat i'd put in bold if the format allowed it: six months is a sample, not a verdict. it is enough to say the index survived contact with real fills and real costs. it is not enough to annualise anything. we publish every month, green or red, and the red ones show up here the same way.
the two layers stay separate everywhere. modeled is twelve months, live is six, published monthly, never blended into one figure. the weights are dated september 30, when the drift family joined, and the whole history is recalculated with them, so old screenshots won't match the page.
i'm the quant at puravida edge. i publish the math behind funded account rules and the monthly results as they land.
@EliteOptions2 90 minutes of hold checked every other minute is 45 chances to exit. at 1 in 50 per check, 0.98 to the 45th leaves about 4 in 10 trades untouched, so the stop and target go out with the entry from the script.
@tradermatt at half a point of fees & slippage per round trip, a 6 point m1 stop on MNQ pays 0.08R a trade before price does anything. a 0.1R edge keeps about 0.02R after that, against 0.08R on a 30 point stop, so the script runs every test with the cost already taken out
@twinsight_x 51 to 100 point stops on MNQ all size to 1 micro at $200 of risk against a $2k drawdown, so the risk actually taken runs anywhere from $102 to $200 on one rule. past 100 points the count floors to 0 and the script skips the order.
@fredtrades 52 in 100 is what a 0.55 hit rate at 1:1 passes when each trade risks half of a $2k drawdown against a $3k target. at $200 a trade the same edge passes about 87, which is why the size per stage is a script input tied to the drawdown left.
@tradercams 3 inputs at 10 settings each is 1,000 runs, and on a zero-edge system the best of 1,000 independent runs averages a t-stat near 3.2. for the best of 10 it's about 1.5, so the script logs how many configs were run next to every result.
where i'd push back: six live months and a model fitted on eighteen. enough to read the shape, not enough to quote a rate.
what would you want to see before trusting it? 8/8
@DumbMoneyHunter 0.9 to the 6th is about 0.53, so six terms you'd each pass 9 times in 10 still fail close to half the accounts once they're stacked. each term is its own check in the script before any order goes out.