When visiting a new city I always plan around neighborhoods rather than specific sights. This website will come in handy! https://t.co/GKQPsBzzih It draws parallels between neighborhoods in a city you know and the one you don’t. **Consider supporting the creator!**
This Thursday, May 6th, RJ Andrews @infowetrust himself will join Stockholm #dataviz meetup to talk about his upcoming book. Don’t miss it! https://t.co/BxGiqfRMH6
🥁🥁If you ever wanted to create more non-standard and beautiful visualizations don’t miss the next Stockholm #Dataviz meetup where @maartenzam himself will share how he does cool things in @rawgraphs. April 13, 17.30 CET. Sign up here: https://t.co/dNhJdJ7afi
Stockholm #Dataviz meetup is growing and on Feb 23rd @duncangeere and @miriamquick themselves (!) will join us to share how they tell stories with music and data. A great opportunity to ask all your questions! Sign up here https://t.co/KtfOM3BycF
I'm excited to speak at #dataviz Stockholm meetup tomorrow ⚡️
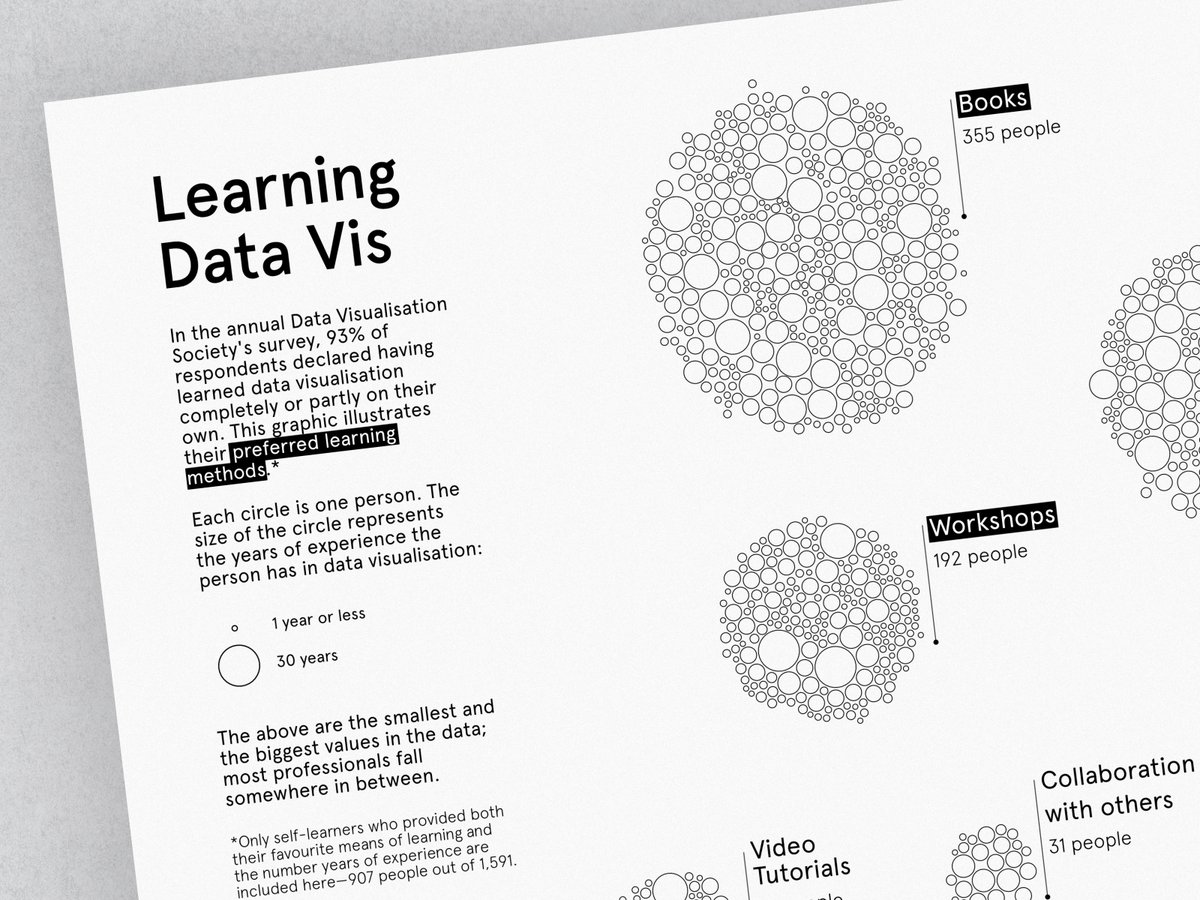
We'll discuss the data design process using my DVS census graphic below as an example. If you want to know how the vis came to life *and* see the bloopers, join us! 📊
🌟🌟
Excited for the next Stockholm #dataviz meetup with the talented @evelinajud. ☺️ Join us!
#12 Practicing the Craft of Dataviz Design ** Public Sector Data Platforms https://t.co/Wz3A4cPtjX
#30DayMapChallenge Day5: blue. Trying to catch up. ⬇️Buildings of Barcelona coloured by the year of constructions. Entirely based on this awesome work by
@dr_xeo
https://t.co/tZhipzgkwT Made with #rstats and #Tableau https://t.co/hwOycu9NiA
#Datafam friends! We're working with 3 charities and are donating to help young people with their digital/data skills. For every person that takes our data literacy course, we'll donate. It's that simple! #tableau https://t.co/e3SRyA3LbD
“How do you create #dataviz that works for 290 different versions of an article?” Join the online edition of Dataviz Stockholm meetup this Wednesday, Dec 9th to hear how @jensfinnas and @cguibourg from https://t.co/coEkGbr9eU solve the challenge. https://t.co/7A4nVqTaJv
W48 | The impact of Operation Fistula's Pilot Programs. 🙌🏻
The visualization based on #DataHumanism ✨ tells the story of the outsized & concrete impact that this kind of funding has on a woman's life. @OpFistula#MakeoverModay#MMVizReview
Link: https://t.co/QxVTaFXqsC
I put together a collage last night of all the maps I’ve made this month so far! 🗺 All of my R scripts for the basic maps are available here (most of the labeling is done in Illustrator to be ⚡️faster): https://t.co/gcEmQlnPN8