#ETH
Position on binance are increasing and long-short ratios decreasing, also the liquidation heatmap shows price around $2100 with higher liquidity.
https://t.co/jWCVFFvvIz
#BTC
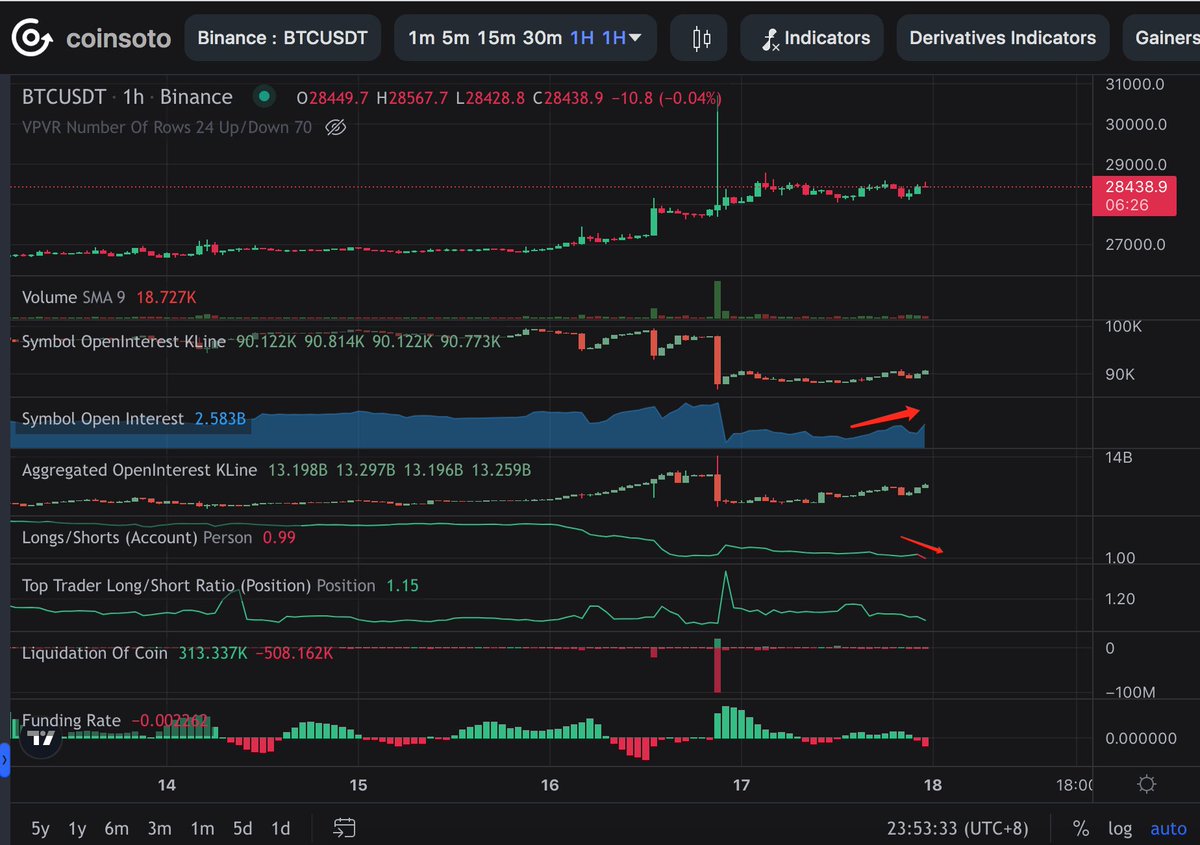
As below chart for contract datas showing that: OI increased and long-short ratios decreased, the liquidation heatmap showing btc dump to liquidate longs, shorts are acummulate energy.
#TRB
Damn it trb! shorts always say!
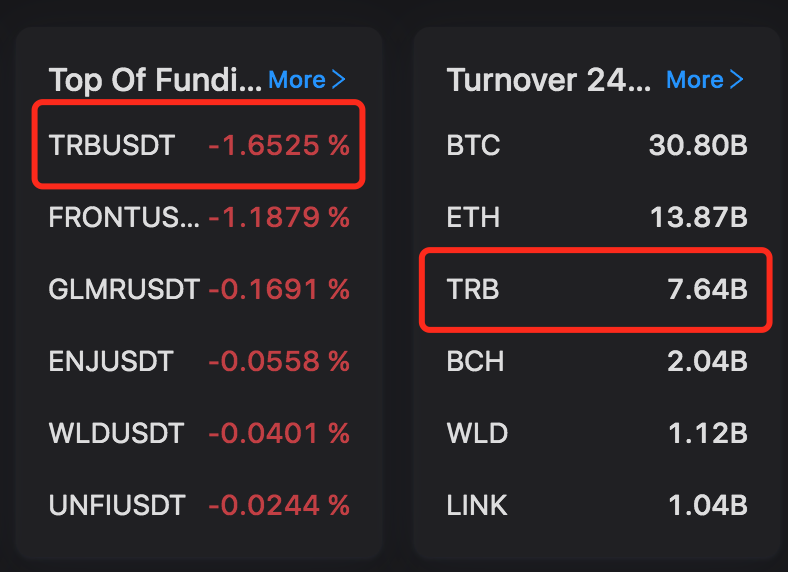
Chart 1 Funding rate and 24-hour turnover are firmly on the list. These two data can be used to look at short sentiment and turnover rate.
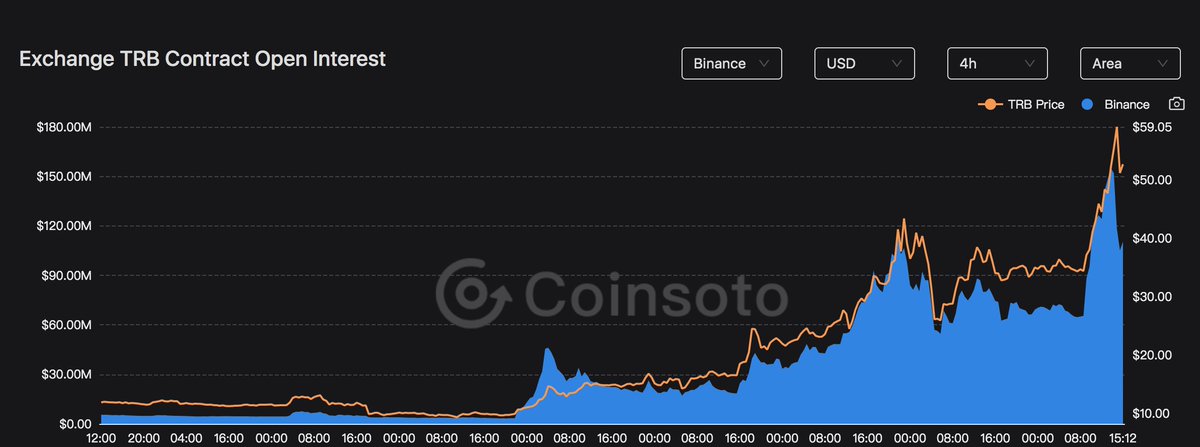
Chart 2 shows the position liquidation data. The short liquidation amount in this wave of breaking through $60 far exceeds the previous wave of breakthroughs at integer points. Those with slightly higher leverage have been wiped out.
Chart 3 shows changes in BN main positions. Since the price exceeded 50 yesterday, the positions have begun to decrease. The order flow data in chart 4 shows that the position delta has decreased simultaneously, but the cvd still shows a slow upward trend. The power of ask > bid. more chasing longs, and the price continues to rise and continue to burst.
Chart 4 Order Flow candle Chart: On the left is BN Perpetual, and on the right is BN Spot Trading Pair. Both trading pairs are breaking through 60 and closing the upper shadow line. There is an imbalance zone of active buying orders accumulation at the top, and selling at the top the market held the long chasing order at the top. The spot POC appeared near the tip of the upper shadow line. After the decline, there was a small rebound until the current narrow range. The range of the red circle shows the negative value of delta. More, that is, bid orders > ask orders, CVD is almost horizontal, and the main force is shipping and absorbing traces.
To sum up: the previous few waves of shorts were unfavorable, and the inertia of bullish thinking was formed. This wave of shorts are not far from victory if they persist. Super strong spot control is unlikely to cause a waterfall, with a negative decline + a small rebound to maintain the average price.
#apt
As alerts in OI&price change last night, apt has break through day boll mid-track and comes along with a big positive line.
Chart 1 shows from the 24-hour position increase ranking that apt’s positions have exceeded 100 million, the funding rate has gone negative, and the ratio of long-short people has dropped to around 1.2. This data needs stay tuned.
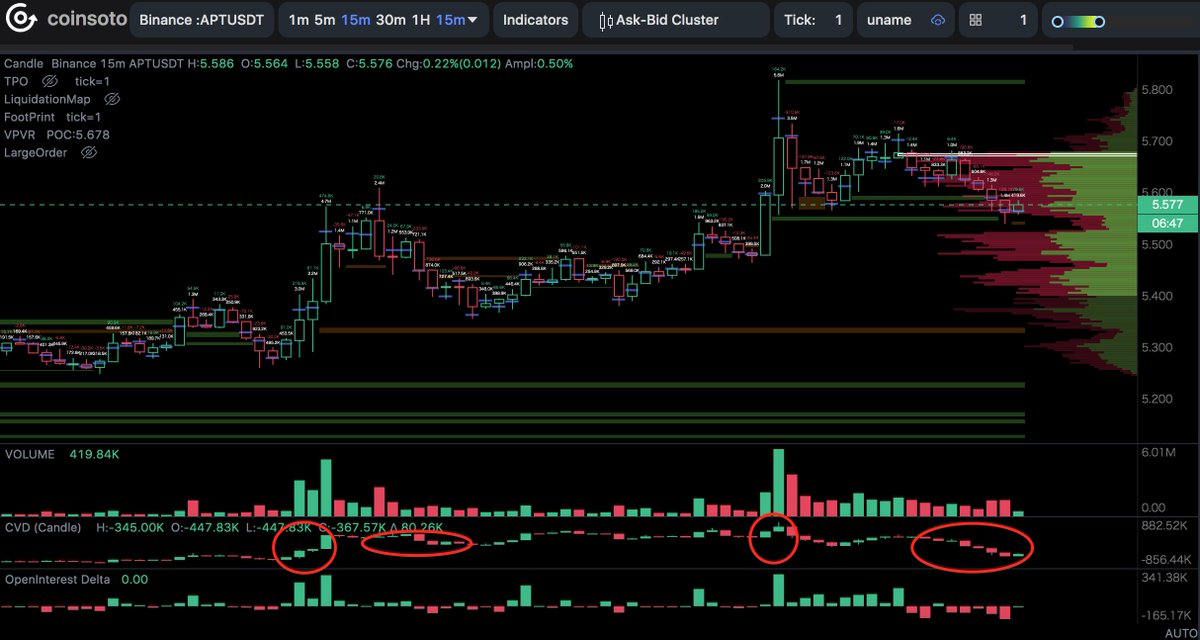
In the K-line of the order flow in Chart 2, it broke through the chip-intensive resistance level of $5.67 and closed at the top of the long upper shadow line. The active buying orders were unbalanced, and a callback immediately ushered in. The deviation of CVD is quite obvious here. By the third wave of rising stage, CVD and positions have all become weaker, Wether if main long and short forces have exchanged? below biggest resistance is $5.3.
Ready for the biggest update on https://t.co/uUS8IYOq3l?
🌊 TESTNET 2.0 IS LIVE 🌊
Take part in the testnet and get prizes from the massive AIRDROP!
Read how to become a tester here: https://t.co/ZqohV8YCd6
#Testnet#Airdrop#FuturesTrading