If you can't write, make an outline
If you can't outline, make a list
If you can't list, summarize sources
If you can't summarize, highlight passages
If you can't highlight, just read
If you can't read, rest
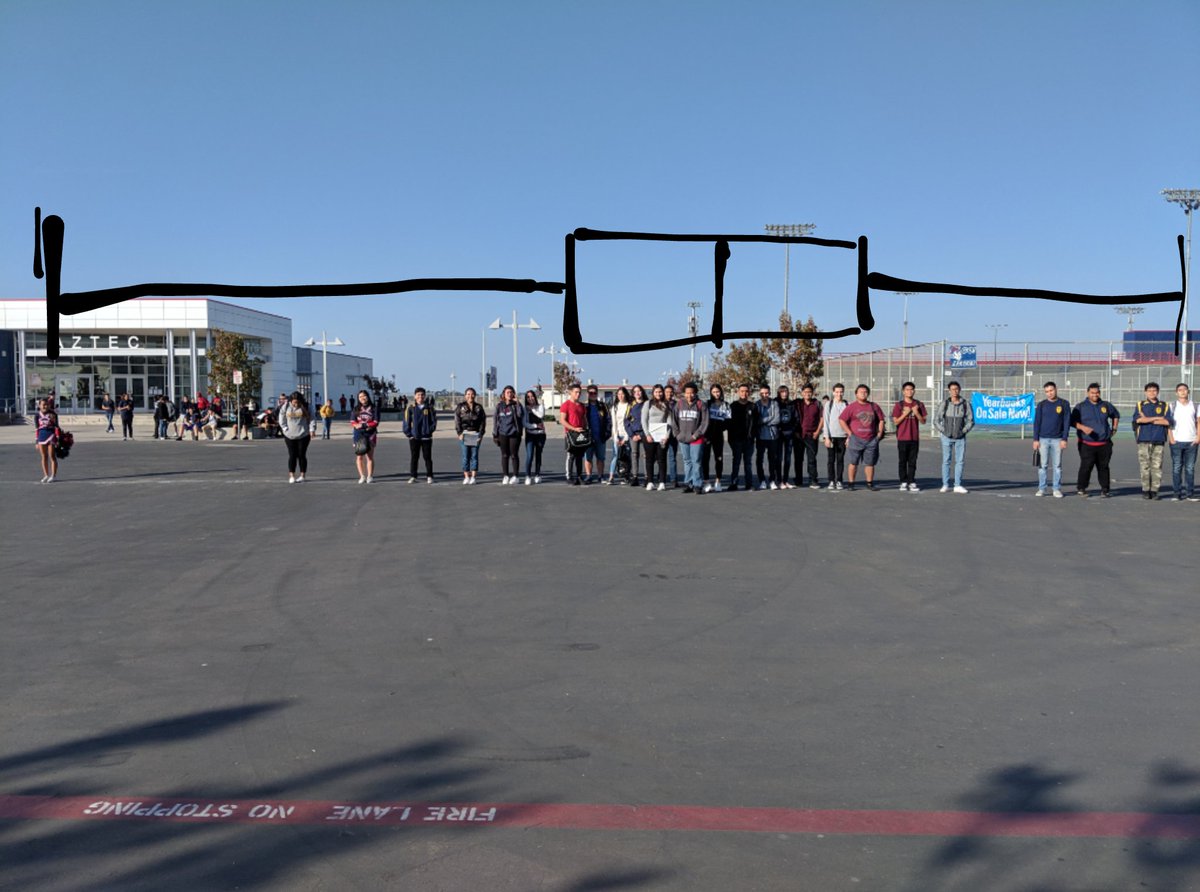
Chalked a number line from 57" to 74". Students stood on their height line. I took a class photo to show how clustered data affects the way a boxplot looks! #mtbos#statschat
Imagine how much more advanced society would be today if women, who comprise half the world’s brain power, were socially & intellectually enfranchised from the beginning of civilization.
Interesting to see variations in “reality” when the questions were investigated by researchers with different identity, training, beliefs and biases. Might there just be interpretivism within positivist and post positivist epistemologies?
I'm most intrigued by the fact that researchers started confident in the effect, got into the data, seemingly lost confidence, and found it again by the time they submitted their reports. What is happening, psychologically, there? We need to study that.
@mpolikoff Thanks for your fantastic description of rotation in factor analyses. You told us to think of the art installation at LACMA and use that to understand rotation. Our whole class loved the example!
Men, if you have ever doubted the fact that your words and actions impact women (which you need to reflect on, in and of itself), here is evidence, proof, or whatever you need to call it that they do.
🇹🇩 The map of the Austro-Hungarian Empire (1867-1918) overlapping the results of the 2014 presidential elections in Romania.
An example of the long term impact of past institutions.
Ever wondered if levels of text cohesion and picture detail interact? So did we! Among many other things. Check out our paper if you like multimedia learning, science learning, and text cohesion.
https://t.co/4WIw64FEYO