Toward a Climate-Smart Nation. The official @NOAA account hosted by the Climate Program Office. Follow for #climate news, #science, #data, resources, and more!
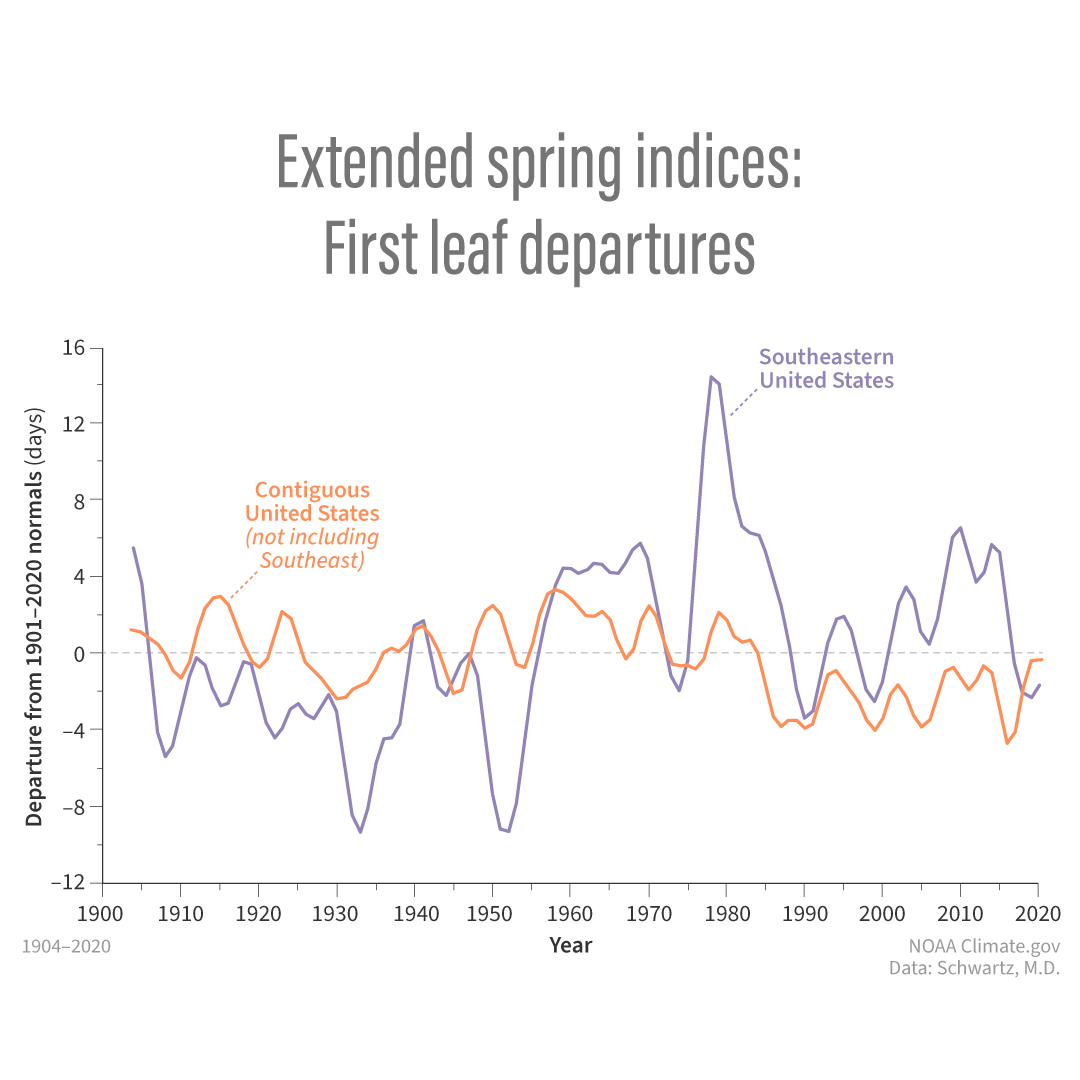
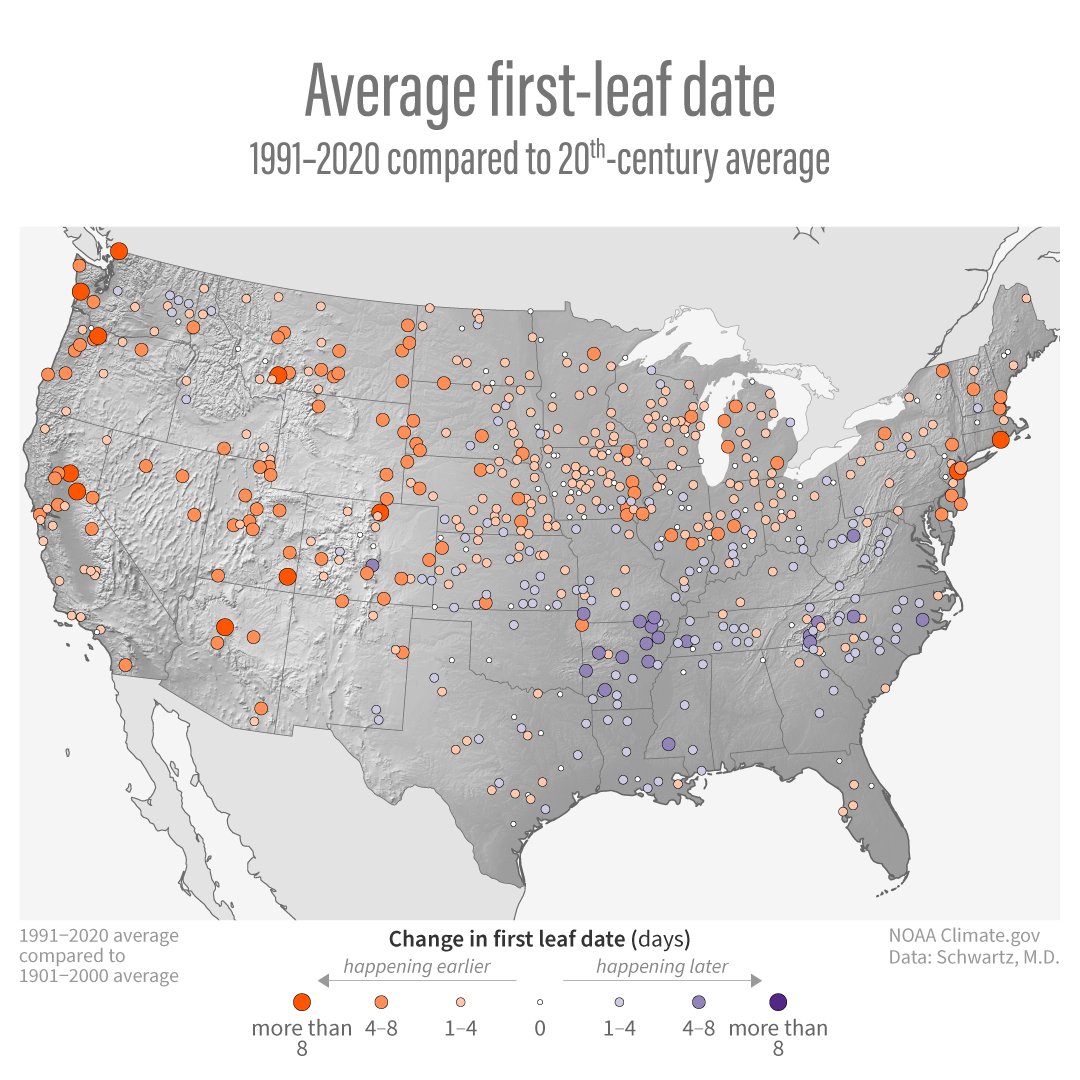
Long-term trends in first leaf and first bloom dates across the U.S. are responding to long-term changes in temperatures. However, the trend across the Southeast may be surprising to some.
Find out why: https://t.co/ySUVLNJgBM
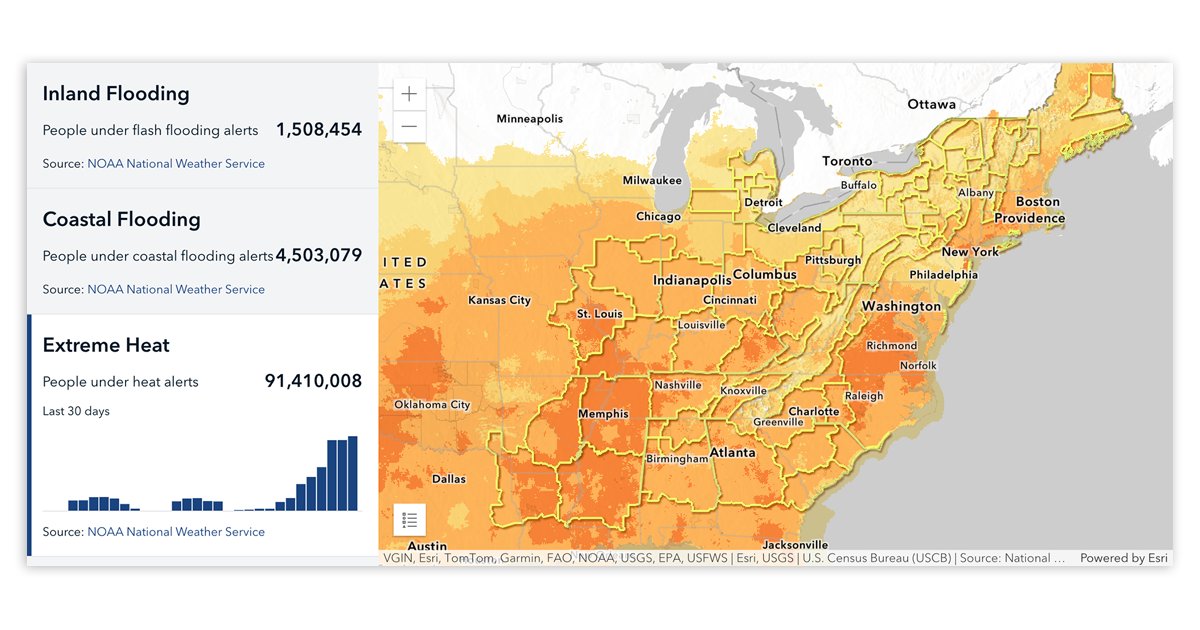
Extreme heat is worsening around the world and the stakes for heat safety are higher now than ever. Heat-related incidents at outdoor events are forcing the private and public sectors to confront the growing challenge of heat governance.
Learn more: https://t.co/Rd4jFtFnfV
June 21 is Show Your Stripes Day—a time to spark conversation about how our world is warming. This video shows how @NOAA temperature data for the U.S. is turned into the iconic stripes visualizations you may see shared today and tomorrow.
@NOAANCEI@ed_hawkins
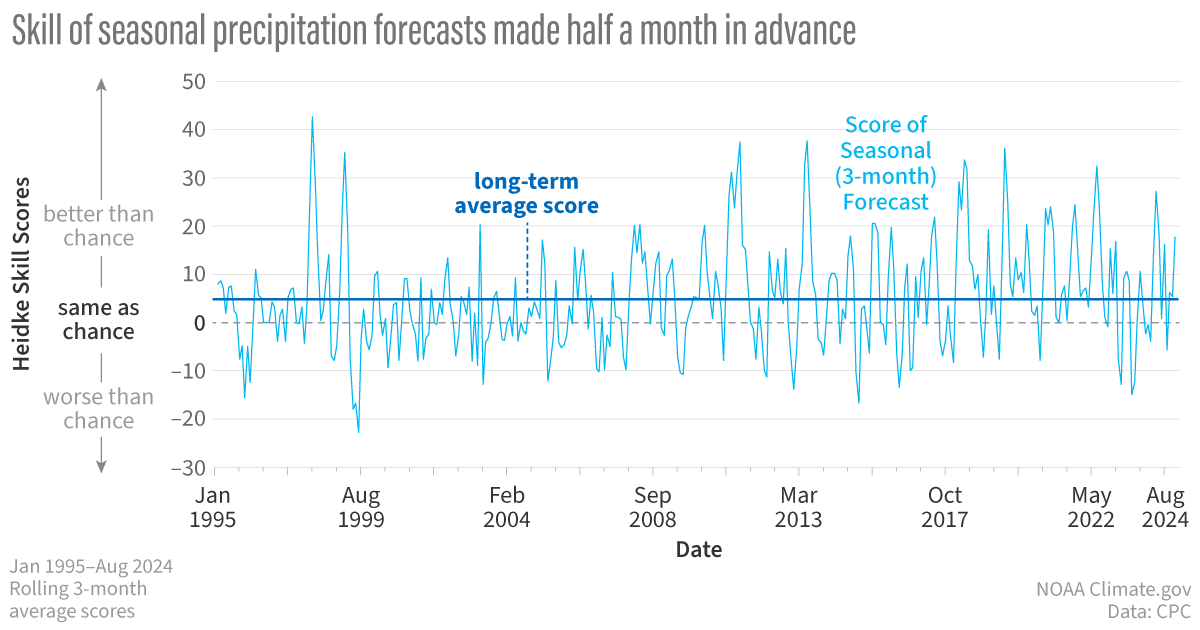
Forecasting rain is more important than ever, but skill hasn't improved since the 1990s. @NOAA 's Climate Program Office is working with partners to boost accuracy and help communities prepare for extreme weather.
Learn more: https://t.co/cJMEAKg1gT
🍃These maps compare this year's leaf-out dates to the first bloom dates. Several areas were in sync. What was extremely rare was the combination of early leaves but late blooms. 💮
If you find an example let us know in the comments!
Read more: https://t.co/wUKnR4dT9q
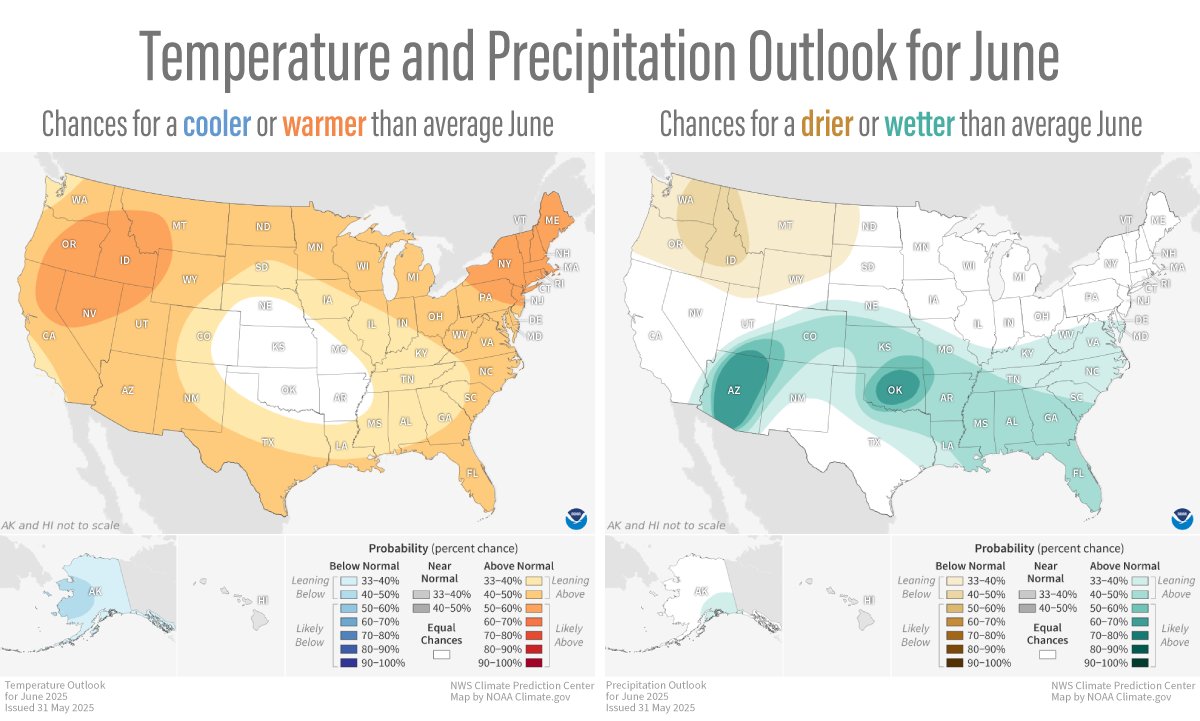
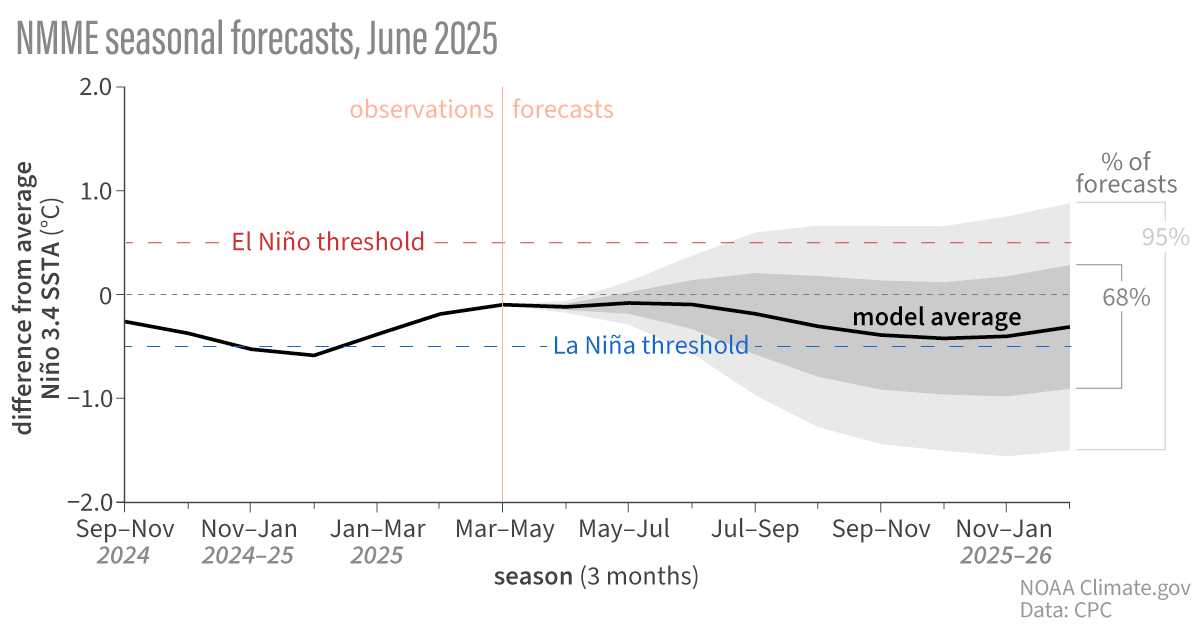
ENSO-neutral conditions are expected to continue through summer.
While the odds of La Niña increase through the fall, the odds of neutral conditions continuing slightly outweigh those of La Niña.
Find out what ENSO-neutral means for seasonal prediction? https://t.co/MLfjvva5vQ
JUST IN: Atmospheric carbon dioxide (CO2) concentrations have peaked for the year at 430.5 ppm.📈
This is 3.6 ppm higher than last year and the second largest May-May increase in the 67-year Mauna Loa record. In 2023, the CO2 peaked at 424 ppm.
🔗: https://t.co/adhNurvOtE
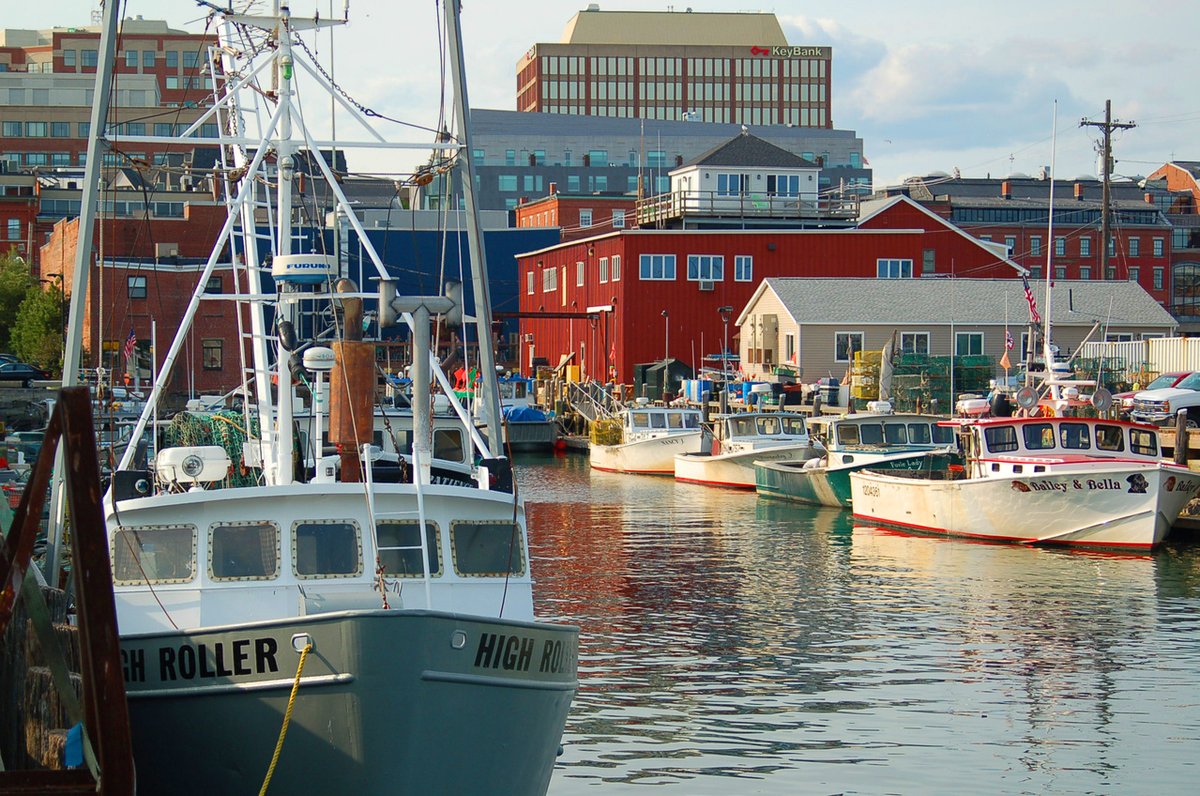
A new experimental @NOAA ocean outlook projects cooler deep waters for #GulfofMaine, historically one of the fastest-warming #ocean regions in the world.
🦞
Learn what’s causing this cool water influx and how it will impact local #ecosystems & #fisheries: https://t.co/yRjp4taKKP
Tornado activity to date has been above average. How does La Niña make tornado-friendly weather more likely? Our guest blogger explains: https://t.co/hQQs9bm70q
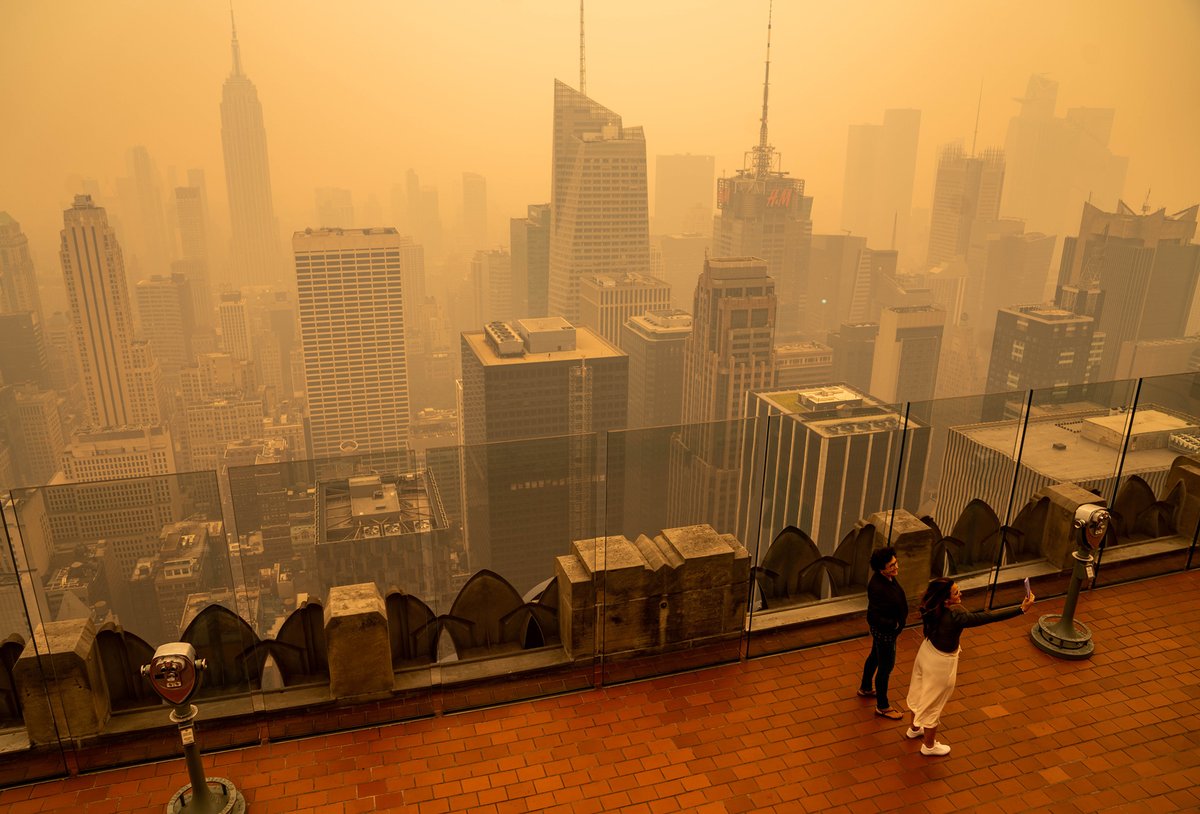
Ever wonder what's actually in #wildfire smoke? Beyond the flames, it brings toxic haze and dangerous #airquality. We break down what’s in the #smoke and how it affects our #health.
Read more: https://t.co/HNohaF1rsM
📸: Anthony Quintano
.@NOAA unveils revolutionary AI-powered Next-Generation Fire System technology🔥🚒
Learn how this new tool can provide alerts in as little as 1 minute from the time energy from a fire reaches satellites, & alert for fires as small as 1/4 acre: https://t.co/A4B9EpNKAP
Today marks the start of #NIHHIS Heat Safety Week! Follow along with #HeatSafety to learn about the risks of extreme heat as well as tools and resources you can use to protect yourself and others.
More: https://t.co/FcqN1T23Jq
Ever wonder what's actually in wildfire smoke? Beyond the flames, it brings toxic haze and dangerous air. We break down what’s in the smoke and how it affects our health. Read more: https://t.co/yqyC251Yw7
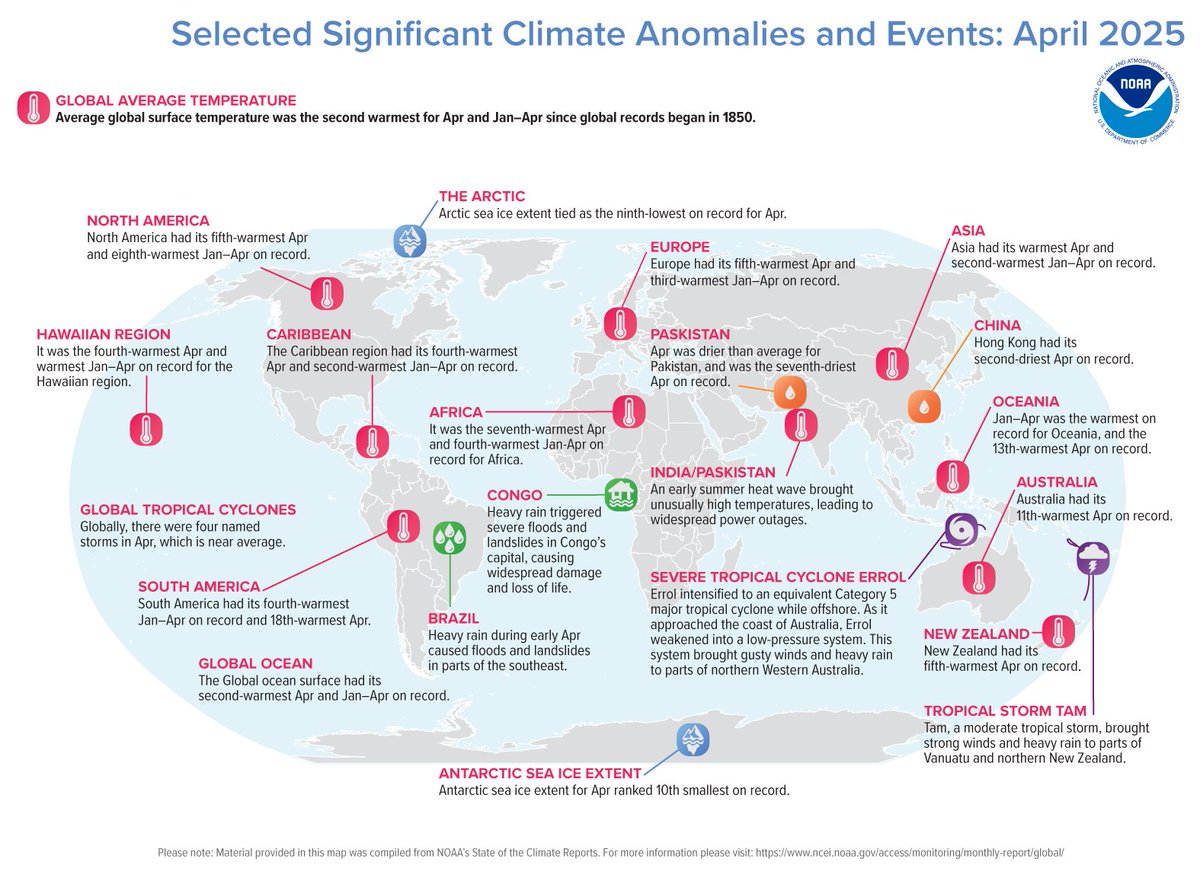
Just in: #April 2025 was 2nd warmest on record for the globe
Access our report highlights with captioned map images at: https://t.co/HaHUo6NSBo
via @NOAANCEI@NOAASatellites
Atmospheric signs of this past winter’s La Niña continue to weaken. As the tropics settle into ENSO-neutral territory, other patterns have a chance of influencing seasonal climate. Will La Niña re-emerge? Our blogger breaks down the odds. Read more: https://t.co/twTjpQSAmZ