The US dollar’s inability to rally despite the surge in yields tells you everything you need to know about the current macro setup.
This should be the ideal environment for dollar strength, yet it continues to struggle.
It appears fundamentally exhausted and poised for a major reversal — entirely consistent with its long-term cycle.
https://t.co/Z4kMcCyuZN
Rick Rule: Why Gold Is Still ‘Stupidly’ Under Owned, Oil Shortages, Silv... https://t.co/lAzxG1Z7BO via @YouTube 07-11-2026 An interview from the Rule Natural Resources Investment Symposium
This is what real hyperinflation does to a stock market.
It is imperative to understand what is happening here.
Early in the move, stock market moves outweigh inflation. Later in the move, stock market gains is no where near the rate of inflation. Many will be fooled by stock markets going up hugely in the later stages when the time comes.
The global economy seems to be slowing now but stock markets are at all-time-highs still. Both of those is because of FIAT currency printing, leading to purchasing power destruction.
Been saying for decades that periods of real, high inflation starts with commodities. And I have repeated this since I called the commodities bear market low in real-time back in 2020. Have also been saying since then that this will lead to stagflation, and maybe even hyperstagflation. And for years now I have been posting big picture evidence charts saying inflation is not backing down, regardless of the made-up media narrative.
With 30 years now in the markets, it takes something extraordinary to make me sit back in my chair, and this is such a chart. It is vital to piece the puzzle together in order to understand what is coming, and in order to be prepared in detail in every way needed. #joinus https://t.co/dZoc2yuE1z
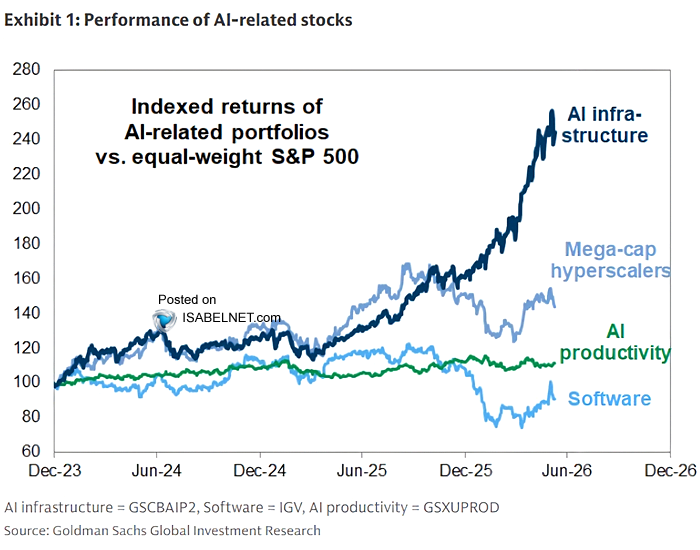
🇺🇸 Returns
Infrastructure has driven the AI rally, with chip giants, data center builders and cloud platforms capturing the upside while software and productivity names fall behind
👉 https://t.co/blMxcoFA78
h/t @GoldmanSachs $spx #spx#ai#equity#stocks
The Nasdaq 100, adjusted for money supply, is now trading close to 5 standard deviations above its long-term trend, where it topped in 2000.
While the rally can continue for a while, long-term investors may not find it attractive from a risk-reward perspective, and could rather focus on more attractive segments of the equity market:
• EMs
• Commodity producers
• Value factor
• Small & mid caps
$QQQ $VOO $IWM $EEM
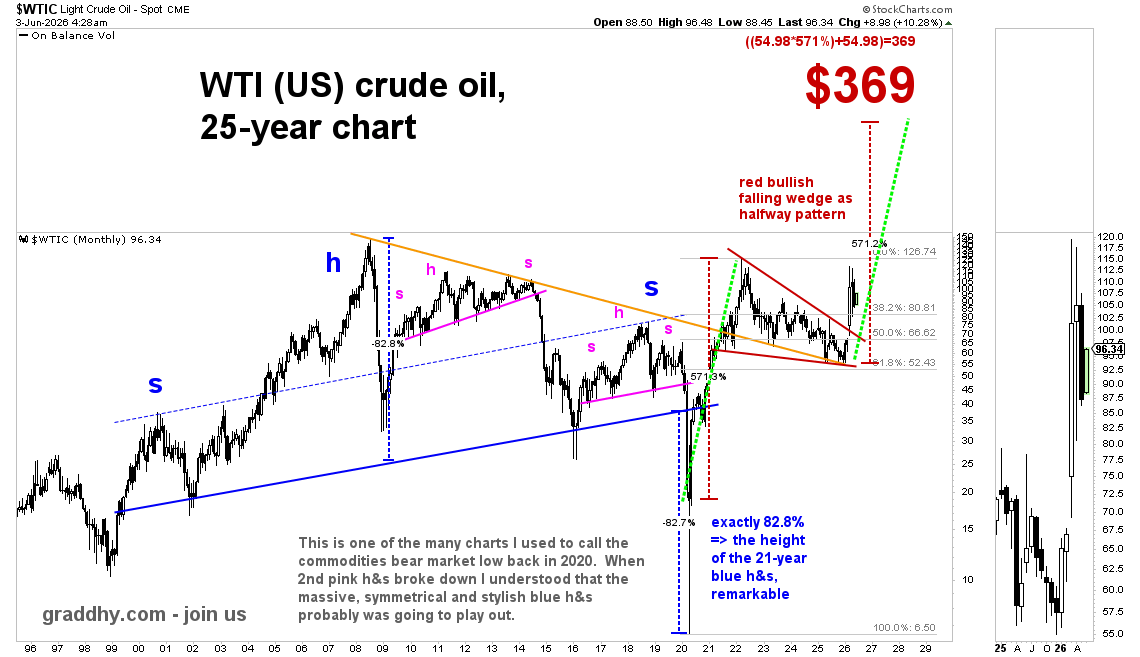
Big oil CEOs are now coming out saying next stop for oil is $150-$160.
The charts showed us that a long time ago.
And, that is a very important red breakout, for many reasons.
One reason being that it kicked off the 2nd inflationary wave.
Been saying for years that we will see at least $250-$300 oil during this commodities bull market.
And in the linked post below I raised that target to $369.
Oil was at $58.40 in the linked post below. Now at $96.
The linked post nailed the low.
The 4.5 year red bullish falling wedge is probably a halfway pattern, with a price target of $369 (green lines measured move approx route).
Since I called the commodities bear market low almost 6 years ago, I have been saying that this commodities bull market is the best opportunity you will ever have in life to get out of the rat race.
When that 2nd pink head & shoulders pattern broke down just before the Covid-crash, I understood that the huge blue head & shoulders pattern was probably going to play out too. And it very much did.
That is the kind of guidance that makes a difference. Following the right people is absolutely vital. #joinus https://t.co/dZoc2yuE1z #oott #oilprice
Check that breakout above red line; a huge gap up above it, then gapfill, then take off. That is stylish price action. And yes, if going to breakout, why not do it in style.