Should I release this one for free tomorrow?
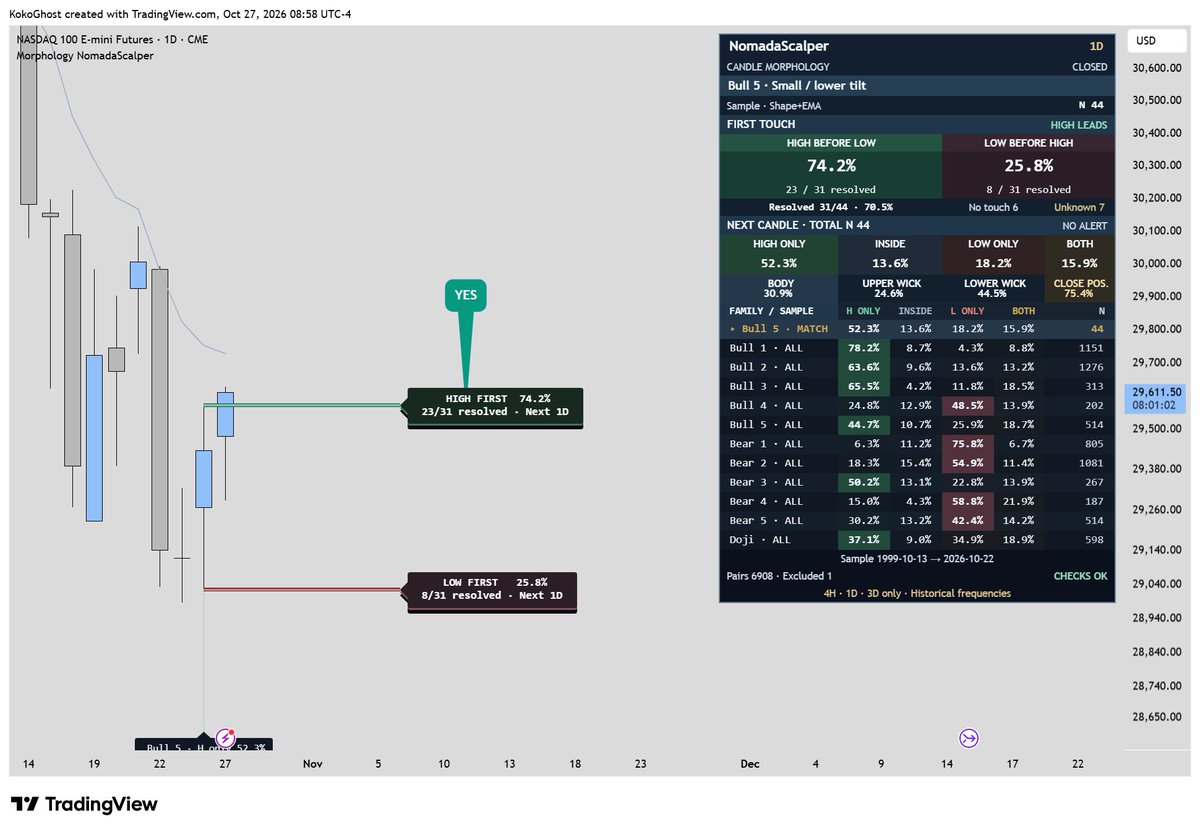
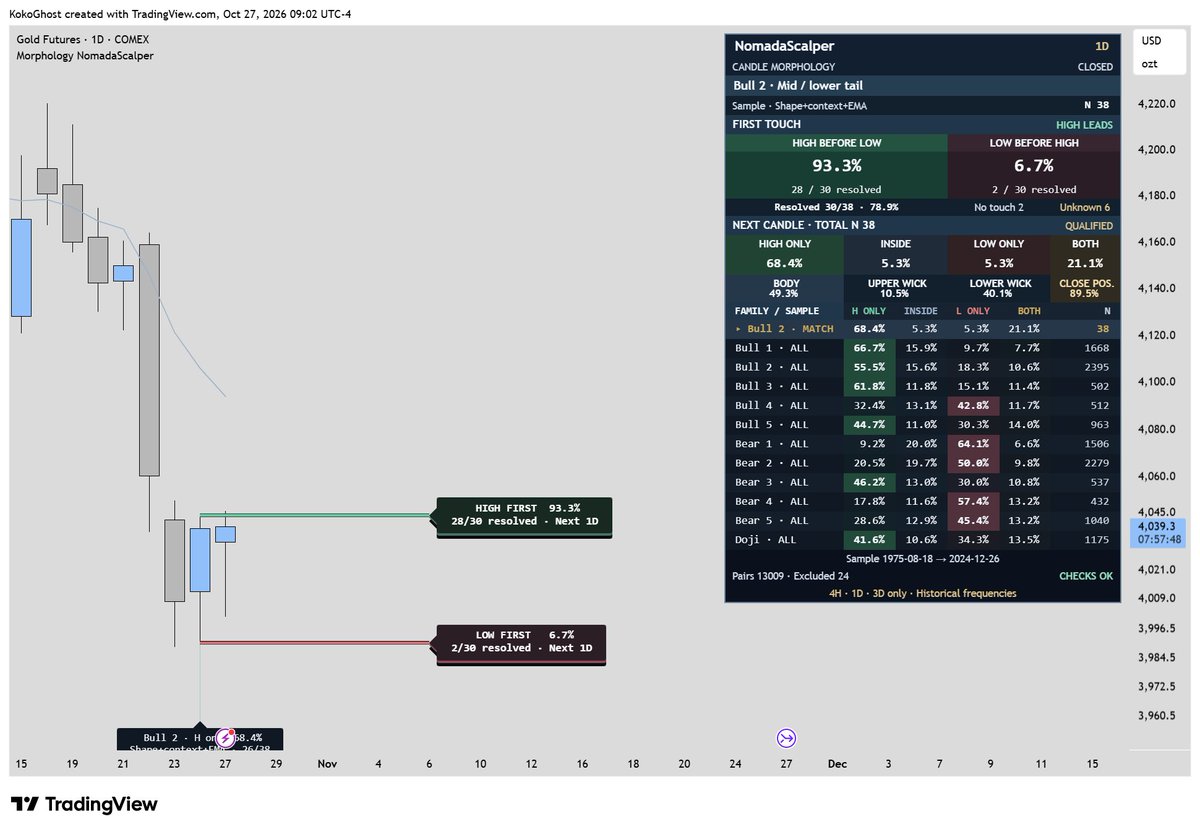
I’ve been building a candle morphology tool that studies what tends to happen after specific candle structures instead of just giving you another buy or sell signal.
It classifies the candle, its shape, its relationship with the previous candle and its EMA context, then compares it with similar historical cases.
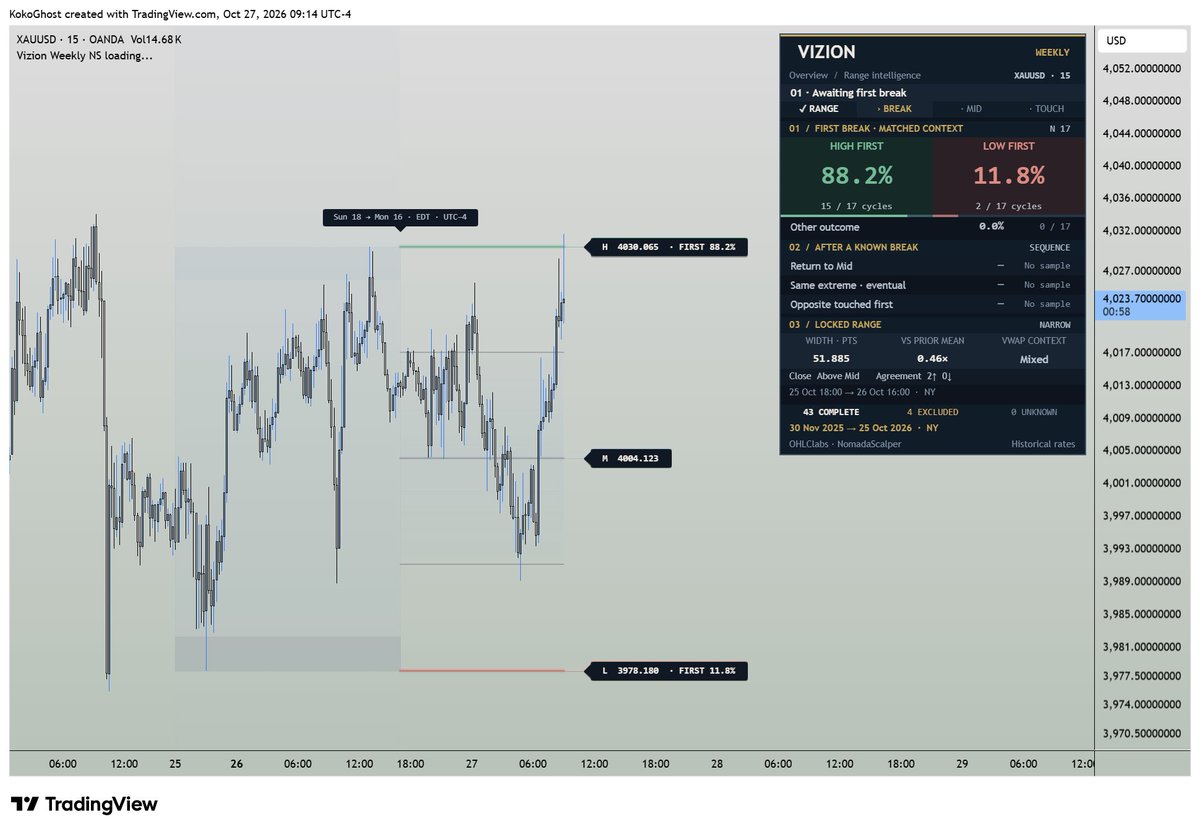
You can study things like which side was reached first on the next candle, how often only the high was taken, only the low, both sides, or neither.
Basically, a different way to study candlesticks through statistics instead of memorizing names and patterns.
I still want to run a few more audits and improvements tonight.
If this post gets enough support, I’ll release it free tomorrow night.
Comment Stats and I’ll publish it.
I’ve never used Candle Science.
I basically took the available candle data from the 1D and 3D charts and had Astra and Claude analyze the wick and body percentages, along with how much price rose or fell that day.
Then I grouped similar candles and looked at what happened the day after they closed.
Nothing complicated.
What should I build next?
I’ll have a few days free and want to release something publicly next week, but I’m drawing a blank today. It could be a trading system, an indicator or a tool you’ve always wanted for your charts.
Leave your ideas in the comments. Tell me what you’d actually use.
In the meantime, enjoy this beauty. It’s completely free.
https://t.co/6bXkoOCfg3
I built Candle Morphology to put historical context behind candle shapes.
It measures bodies and wicks on 4H, 1D and 3D charts, then studies what happened after similar candles, including whether the high or low was reached first.
You can see the sample size, compare candle families and identify cases where the sequence could not be determined. The percentages describe historical behavior, giving you a starting point for your own research.
Free to use on TradingView.
https://t.co/6bXkoOCfg3
There are traders like me coming from restricted countries who still build and publish genuinely useful indicators.
If you added a proper crypto payment processor for creators, it would open the door for a lot more developers who currently struggle with traditional payment restrictions.
That could be a real game changer and give platforms like TradingView some serious competition.
A lot of people want me to tell them I have some hyper secret trading method.
The reality is much simpler. I trade in a way many people already understand.
What I’m actually good at is waiting for my GCGrid levels, trading mostly during Asia, staying calm, and taking the same risk without forcing anything.
That’s it.
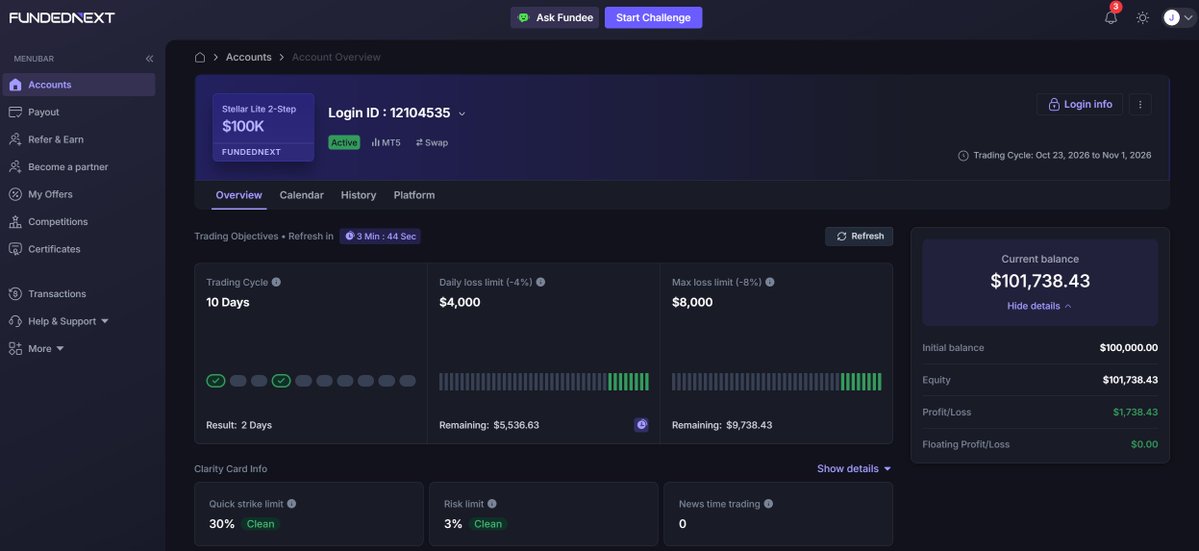
Another FundedNext payout is already secured for this month.
I’m not trying to be the most innovative trader. I’m just profitable doing the same things over and over again.
@ColquhounMoira You’re the ones I should be thanking for trusting me, especially when I’m still basically a complete unknown on social media.
I really appreciate it. I’ll give everything I can over these next 30 days and make sure the work speaks for itself.
Should I release this one for free tomorrow?
I’ve been building a candle morphology tool that studies what tends to happen after specific candle structures instead of just giving you another buy or sell signal.
It classifies the candle, its shape, its relationship with the previous candle and its EMA context, then compares it with similar historical cases.
You can study things like which side was reached first on the next candle, how often only the high was taken, only the low, both sides, or neither.
Basically, a different way to study candlesticks through statistics instead of memorizing names and patterns.
I still want to run a few more audits and improvements tonight.
If this post gets enough support, I’ll release it free tomorrow night.
Comment Stats and I’ll publish it.
One of the biggest enemies in trading is believing you have the absolute truth.
Some traders become so obsessed with perfection that if a model doesn’t have 100 years of backtesting, they won’t even consider it.
They keep searching for certainty, adding filters, changing systems and trying to eliminate every possible loss.
And somehow the result is always the same.
They still aren’t withdrawing.
At some point you need to stop looking for a perfect system and start learning how to work with probabilities, manage risk and execute something that actually has an edge.
Looking for a simple NQ strategy that was profitable in this 2026 backtest?
Here's the London setup I tested.
Mark the 20:00 to 02:00 range, New York time. Wait for a 5-minute candle to close beyond the range, with the breakout aligned with both the 50 and 200 EMAs.
Then wait for a pullback 12.5% into the range. Place the stop at the opposite range boundary and target 0.5R.
No EMA alignment, no entry.
The RangeLab backtest shown covers July 12 to October 22, 2026: 29 trades, a 79.3% win rate and +6.31R net.
A small historical sample, and a starting point for further testing.
What range would you test next?