Starting this account to share my tools, analysis, and automated systems with people who are looking for a systematic edge.
You can find my free tools on TradingView: https://t.co/1hCecvsVBE
And also on Whop, where I'll be sharing more premium tools 💎:
https://t.co/XNoobTfq0D
Half of crypto news is:
“Bitcoin ETFs just bought $600M.”
“ETF inflows just hit $1B.”
“Institutions are piling in.”
It gets attention, but one big flow print tells you nothing about the actual institutional trend.
I wanted something that cuts through the daily ETF headline farming and answers an actual question:
Is institutional capital flow actually strengthening or deteriorating? And how can we best measure and derive a signal from that?
See the results for yourself, 30-day free trial available now:
https://t.co/ZHkw83LE45
One of the easiest ways to ruin a strategy is to improve the backtest too many times.
Try 30 lookbacks.
12 thresholds.
6 filters.
4 exit rules.
Keep the best combination.
Then fix the ugly part of 2022.
Then add another feature because it improves Sharpe.
Then test a few more markets.
Eventually, you have given yourself hundreds or thousands of chances to find something that looks great by accident.
That is overfitting in plain English.
The dangerous part is that every individual change can sound reasonable.
A slightly better threshold.
A cleaner filter.
One more confirmation.
A parameter that “fits the asset better.”
But repeated parameter sweeps, feature mining and backtest edits are all forms of multiple testing.
The more versions you test, the higher the chance that noise starts looking like edge.
This is why the best historical result is often the one I trust the least.
I would rather see a strategy remain decent when:
- parameters are moved slightly
- a feature is removed
- costs are increased
- the market regime changes
- the data moves out of sample
A robust system usually has a region where it works.
An overfit system often has a single beautiful point.
bitcoin:native has pulled back toward $83K, and the more interesting move this week is happening underneath price.
Analysis + TL/DR at the end:
1. Derivatives
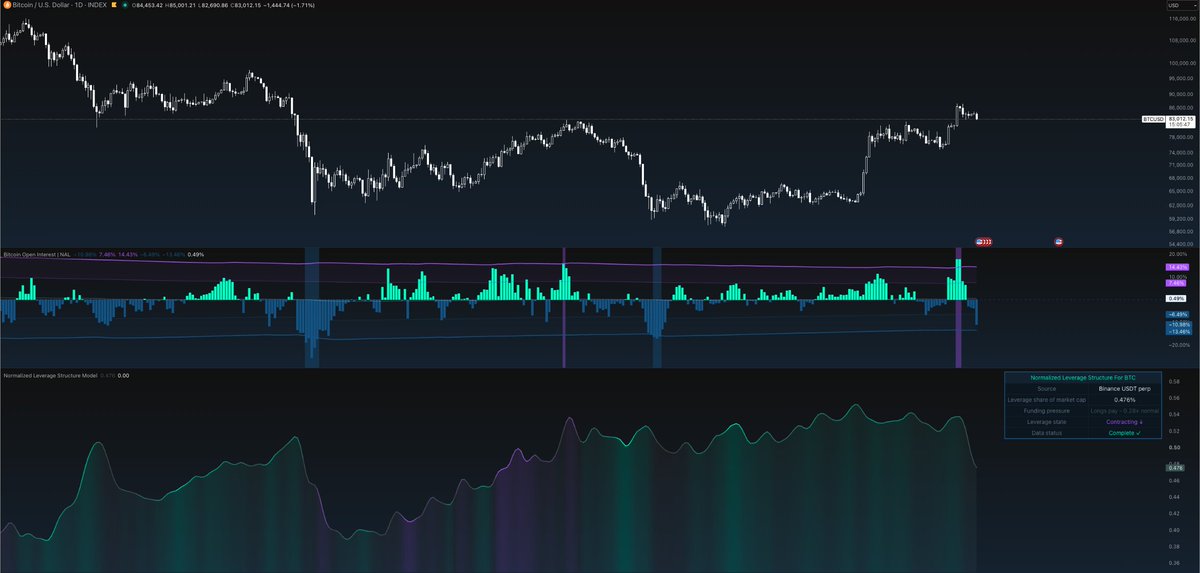
Bitcoin open interest is now -10.98% over the last seven days, down from +0.97% in last week's analysis.
That puts OI close to the model's lower extreme around -13.46%.
The Normalized Leverage Structure Model (NLSM) tells the same story.
Leveraged open interest has fallen from roughly 0.538% of BTC market cap last week to 0.476% today, with the model now classifying leverage as contracting.
The speed of the decline is important. The current contraction in normalized leverage is visibly sharper than the deleveraging episode around the end of June.
So while price is weaker, the derivatives market is also becoming substantially cleaner.
There is one part I don't like as much.
A new model we're rolling out, Derivatives Risk Sentiment (DRS), is currently at 2.22, above its upper threshold.
Both Bitcoin and altcoin derivatives are contracting, but not equally.
BTC: -12.42%, Z = -2.36
Alts: -1.54%, Z = -0.69
Bitcoin traders are deleveraging much faster than the alt market.
That relative persistence in alt leverage tells me speculative appetite has not disappeared. Traders are still holding considerably more risk further down the curve while BTC gets cleaned out.
I treat that as a sentiment warning.
The absolute leverage picture is improving quickly, but the location of the remaining speculation is less comfortable.
2. On-chain / Market Internals
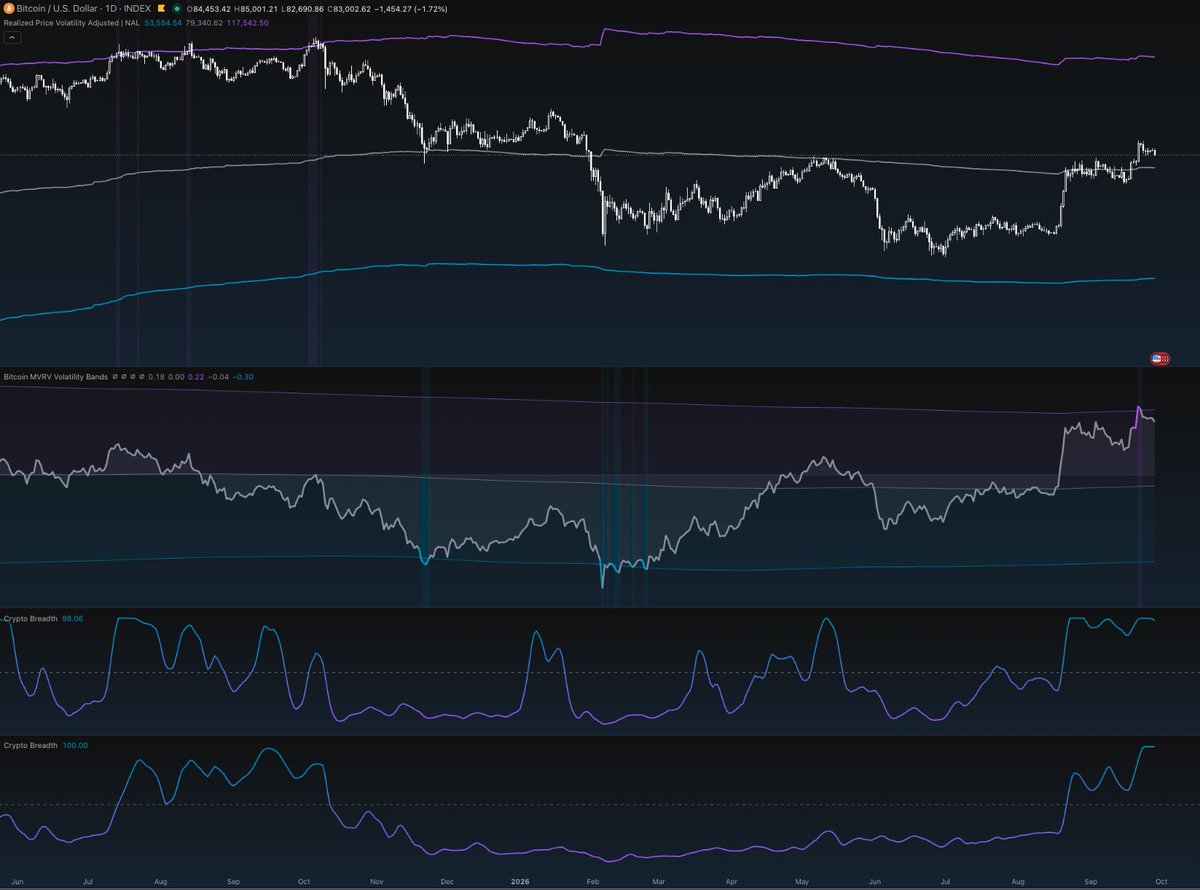
Breadth has now reached an interesting extreme.
Last week, around 87% of the crypto universe was above its 200-day moving average.
Today it is 100%.
That validates the broader-participation theme we discussed last week. This recovery has spread through essentially the entire tracked universe rather than remaining concentrated in Bitcoin and a handful of large caps.
But 100% also means there is nowhere further for that metric to expand.
In the history shown by the model, the 200-day breadth reading has not tended to remain pinned at its ceiling for long.
Shorter-term breadth is already showing the first signs of cooling.
Around 98.06% of tokens remain above their 50-day moving average, but the reading has started rolling over after reaching saturation.
So breadth is still extremely strong.
It is also extremely mature.
The MVRV Volatility Bands tell a similar story from a valuation perspective.
The oscillator has eased from its latest spike but remains around 0.22, close to the upper region of the model.
Bitcoin is therefore still carrying elevated medium-term profitability even after the latest pullback.
The longer-term Realized Price Volatility Adjusted (RPVA) model is less stretched.
BTC is trading around $83K, with the volatility-adjusted realized-price midline around $79K.
Bitcoin only reclaimed that level recently, and it now sits directly underneath price. Previous periods in the chart show that this central realized-price region can become an important structural area once price moves back above it.
That gives us a useful split:
Medium-term valuation remains elevated.
Long-term valuation structure is considerably less extreme.
3. Institutional
Read the institutional analysis, as well as what I'm doing with this information in our community.
Link in Bio.
TL/DR
The market is weaker on price, but significantly cleaner on leverage. Yet, the speculation problem hasn't completely gone away.
Medium-term overbought, long-term neutral/below cycle mean.
The internal structure remains strong.
The margin for excess is getting smaller in the short-medium-term.
bitcoin:native is pushing back toward $84K, and the internals still look strong.
Leverage is rebuilding without obvious excess, breadth has expanded sharply across the market, and BTC just cleared a major liquidation pocket above the recent range.
1. Derivatives
Bitcoin open interest is only +0.97% over the last week.
At the same time, the Normalized Leverage Structure Model (NLSM) shows open interest at roughly 0.538% of BTC market cap, with leverage expanding and longs paying around 1.15x normal funding.
That is a fairly composed derivatives structure considering the size of the recent move.
OI is rising, but it is not exploding. Funding is positive, but not at the kind of level that would suggest the market is already heavily crowded on one side.
The liquidation map adds another interesting layer.
BTC has now pushed through the large concentration of liquidations sitting directly above the previous range. That liquidity has effectively been cleared, while the next meaningful overhead cluster sits around $93K.
There are still large liquidation concentrations below the market, but they are considerably further from current price.
2. On-chain / Fundementals
The MVRV Bollinger Bands are showing an elevated reading, with the oscillator sitting close to the upper end of its 730-day exponentially weighted range.
That deserves attention. Profitability and valuation are clearly no longer depressed.
But it is only one part of the picture.
The Realized Price Volatility Adjusted (RPVA) model also gives some context here, particularly as realized BTC volatility has compressed substantially relative to previous periods.
More importantly, breadth has changed very quickly.
Around 99% of the crypto universe is now above its 50-day moving average.
That is close to maximum short-term participation.
The longer-term breadth signal is arguably more interesting: roughly 87% of tokens are now above their 200-day moving average.
That puts market participation much closer to the kind of levels seen during the summer of 2025, rather than a rally being carried by Bitcoin and a handful of large caps.
3. Summary (TL/DR)
The market still looks structurally strong.
Breadth has expanded across both short and long horizons, BTC has cleared a major overhead liquidation pocket, and derivatives positioning remains relatively controlled despite the move higher.
The main caution is that short-term breadth is already extremely stretched and MVRV is elevated.
For now, those conditions look more like signs of a strong advance than clear evidence of exhaustion, especially while leverage and open interest remain composed.
Institutional and Macro Data
I’ll be posting the premium analysis on Whop with ETF/institutional data, macro conditions, and my full cross-market take and algorithmic crypto positioning at the end.
You can own 20 crypto assets and still be making one bet.
If every position loads on the same liquidity and risk-on factor, the tickers are different, but the portfolio can still fail for the same reason.
Now layer on leverage, thin liquidity, execution slippage and event risk.
Your expected edge may be unchanged, while the number of ways the portfolio can break has multiplied.
That is the risk I care about most.
Some risk has a clear purpose. Concentration can reflect a real edge. Leverage can scale a robust return stream. Illiquidity can be worth bearing when the expected compensation is high enough.
Redundant factor exposure, accidental concentration, unintended basis risk and poor execution are harder to justify.
Before I accept any source of risk in a portfolio, I want one answer:
What is this risk actually paying me for?
If that answer is unclear, the portfolio is fragile.
bitcoin:native flashed a overbought signal yesterday on the BTC MVRV Volatility Bands, and immediately pulled back.
This last time it flashed overbought was in November 2024!
Net Profit % might be the easiest number in a backtest to make look impressive.
+800% sounds incredible.
Then you find out it took 12 years, suffered a 65% drawdown, used aggressive position sizing, and the underlying asset made +1,400%.
Net profit is simply the strategy's cumulative P&L relative to its starting capital.
Whenever I see a huge net profit, I immediately want to know:
Robustness. Volatility. Performance metrics. Benchmark Return. CAGR. Max Drawdown. Fees.
Without those, the big percentage is missing the whole story. @tradingview separates these metrics for the same reason: cumulative return, drawdown, CAGR and buy-and-hold performance answer different questions about the strategy.
Leverage entering markets doesn't automatically mean a market is overleveraged.
The same amount of leverage can mean something completely different depending on the size of the asset.
That's the problem that the Normalized Leverage Structure Model (NLSM) solves.
It gives you a much cleaner view of how the derivatives market. You will see the leverage entering the markets, what proportion of the coin's activity it takes a share of, and what direction the leverage is being applied (long/short).
See it for yourself:
https://t.co/PibJfLvRzm
RSI can look strong while the market underneath it is already heavily levered. Thats a problem.
When everyone and their mom are deep in leverage, betting on a one more big pump, the market goes against them and they get liquidated.
It conditions the momentum reading of an RSI using perpetual open interest of the underlying #crypto asset. As leverage becomes unusually elevated, the RSI readings receive less conviction instead of being treated the same as they would in a cleaner, more sustainable market.
See the results for yourself:
https://t.co/9vLt0Lxsy1
Sigmoid Suite Universal Strategy is now live for our members!
Not a member? You can access it with the 30-day free trial.
This is another proprietary, universally designed crypto strategy, built from five distinct model suites covering volatility, statistical displacement, relative strength, efficiency and regime.
Available now on TradingView:
https://t.co/giFfscr41B
bitcoin:native is pushing back toward $84K, and the internals still look strong.
Leverage is rebuilding without obvious excess, breadth has expanded sharply across the market, and BTC just cleared a major liquidation pocket above the recent range.
1. Derivatives
Bitcoin open interest is only +0.97% over the last week.
At the same time, the Normalized Leverage Structure Model (NLSM) shows open interest at roughly 0.538% of BTC market cap, with leverage expanding and longs paying around 1.15x normal funding.
That is a fairly composed derivatives structure considering the size of the recent move.
OI is rising, but it is not exploding. Funding is positive, but not at the kind of level that would suggest the market is already heavily crowded on one side.
The liquidation map adds another interesting layer.
BTC has now pushed through the large concentration of liquidations sitting directly above the previous range. That liquidity has effectively been cleared, while the next meaningful overhead cluster sits around $93K.
There are still large liquidation concentrations below the market, but they are considerably further from current price.
2. On-chain / Fundementals
The MVRV Bollinger Bands are showing an elevated reading, with the oscillator sitting close to the upper end of its 730-day exponentially weighted range.
That deserves attention. Profitability and valuation are clearly no longer depressed.
But it is only one part of the picture.
The Realized Price Volatility Adjusted (RPVA) model also gives some context here, particularly as realized BTC volatility has compressed substantially relative to previous periods.
More importantly, breadth has changed very quickly.
Around 99% of the crypto universe is now above its 50-day moving average.
That is close to maximum short-term participation.
The longer-term breadth signal is arguably more interesting: roughly 87% of tokens are now above their 200-day moving average.
That puts market participation much closer to the kind of levels seen during the summer of 2025, rather than a rally being carried by Bitcoin and a handful of large caps.
3. Summary (TL/DR)
The market still looks structurally strong.
Breadth has expanded across both short and long horizons, BTC has cleared a major overhead liquidation pocket, and derivatives positioning remains relatively controlled despite the move higher.
The main caution is that short-term breadth is already extremely stretched and MVRV is elevated.
For now, those conditions look more like signs of a strong advance than clear evidence of exhaustion, especially while leverage and open interest remain composed.
Institutional and Macro Data
I’ll be posting the premium analysis on Whop with ETF/institutional data, macro conditions, and my full cross-market take and algorithmic crypto positioning at the end.
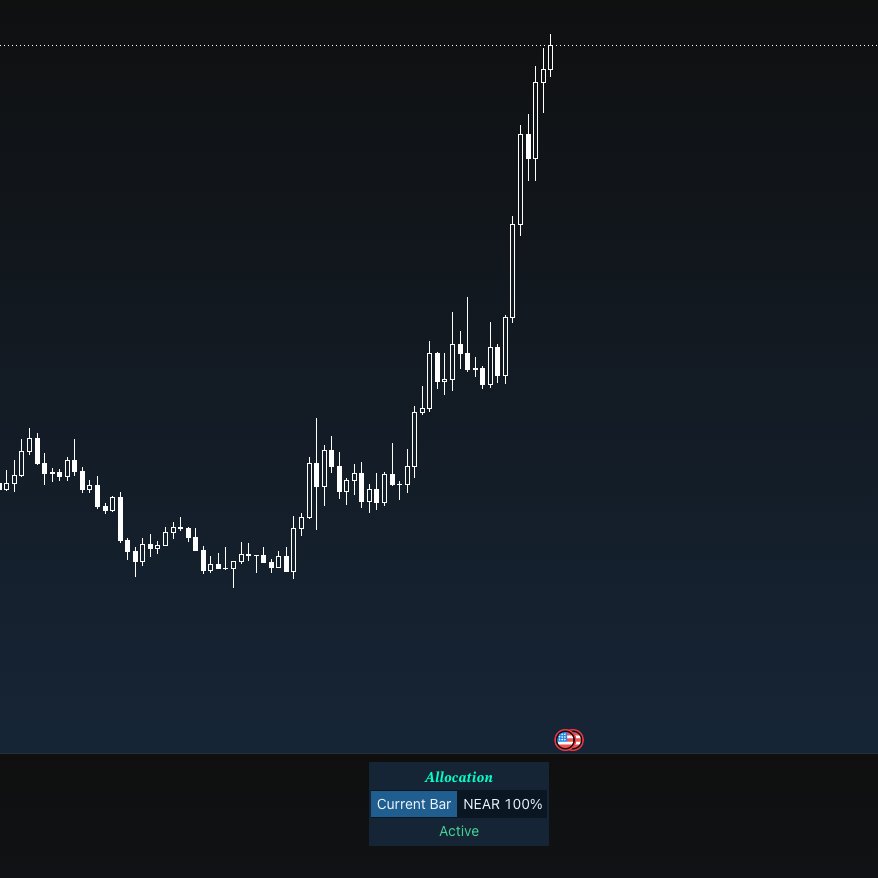
While most of the crypto market is leveling out after the pump, near:native is still ripping higher.
It's hard to determine which assets refuse to stop moving when the rest of the market does.
But RSRM accurately singled out the best token and let us ride the equity back to all-time highs! All while the market is down 40% ON AVERAGE!
Model available soon... 👀
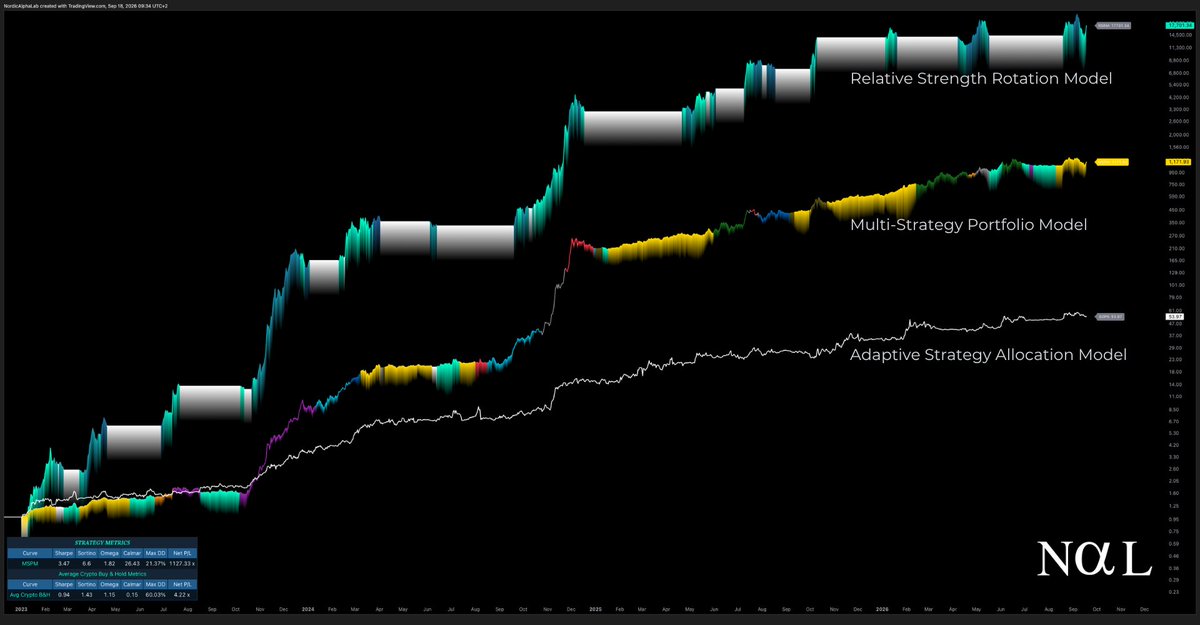
Three models. One portfolio architecture.
Relative Strength Rotation Model
Multi-Strategy Portfolio Model
Adaptive Strategy Allocation Model
A lot has been built quietly behind the scenes.
More is coming to the paid community very soon.
Parallax Strategy is now live for our members!
If you're not a member, get your 30-day free trial now!
It's proprietary systematic strategy designed to operate universally across crypto, with the tested ability to outperform the broader crypto universe.
Available now on TradingView:
https://t.co/r89x4iO8gT
A backtest can look completely convincing right up until the model reaches data it never saw.
In-sample here: +102%, 0.98 Sharpe, -14.6% max drawdown.
Out-of-sample: -27.3%, -0.46 Sharpe, -32.8% max drawdown.
Nothing magical happened at the split. The historical fit simply didn’t survive new data.
Test enough lookbacks, thresholds and filters and eventually some combination will fit the noise. Add execution assumptions the live market may never give you, or build the whole thing around one unusually favorable regime, and the backtest can keep getting cleaner while the actual strategy becomes more fragile.
This is what out-of-sample testing is for: checking whether the behavior survives once the model reaches data it was never tuned on.
The uncomfortable part of research is not making the backtest look better. But trying to break it before the market does.