Oh man, this is a very tricky question. I can write a lot about it.
But I can tell you this:
Doesn't matter where the market moves from and to where it's gonna move to, there will always be an External Range liquidity and an Internal range liquidity.
If you're on 15M, then you have your IRL and your ERL. Then you go to 1H and you see the 15M you were looking at previously is actually just an internal range of the 1H. Then you go to the 4H, you see that the 1H itself was only an IRL and the 4H is external.
Then you do this for daily, monthly, quarterly, yearly and so on...
There is always an external range above your external range and there is always an internal range inside your internal range.
You'll find a 1 minute internal range, which in itself is an external range of a 30S internal range.
So does the market move from internal to external? Yes, always. Does the market moves from external to internal? Yes, always.
Imagine you’re looking at a set of gears in a machine. The small gear turns inside a bigger gear, which is part of an even larger system of gears. No matter where you look, each gear is driven by the movement of something larger, but at the same time, every larger gear is composed of smaller movements inside. The system is infinite in both directions, and every part depends on another to keep the whole thing moving.
It's like saying:
"Doesn’t the market always move from bearish to bullish and from bullish to bearish?" Yes, always. But knowing this doesn’t really add anything to your understanding. The market will move somewhere, and anyone trying to convince you they know why will say it's because of some IRL you didn’t notice. But here’s the catch: there’s an infinite number of these everywhere, on every timeframe. Every time you try to short a high which is an ERL, and you fail, you'll find someone to tell you there was another ERL above that, and that your ERL was itself an IRL, lol.
Basically: They are right, but this is the most basic function of the markets. It's like saying: does the market moves from bottoms to tops and from tops to bottoms? lol
What matters is knowing where it will go from one to the other, how it will get there, when it will happen, and exactly how and when you can position yourself with the right stop and TP.
Which is basically one of the hardest things to do.
🧵Introducing “Statistical Volatility,” a new indicator in collaboration with @toodegrees designed to help you track the volatility of each candle throughout the day, week or month. This tool helps traders to anticipate when the market might expand or consolidate.
Link below 👇
the narrative is brought to you by the structure at open
trending environments are so favorable because the open to high (-OB), to (Distribution) low to close is repetitive in nature when the objective has not been met
9.24.24 [NQ] Journal
Visualizing the O[H]LC when bearish, under the requirement of a significant liquidity sweep, and an orderblock forming the high of the candle, creating the distribution
where distribution is now = to body of HTF candle
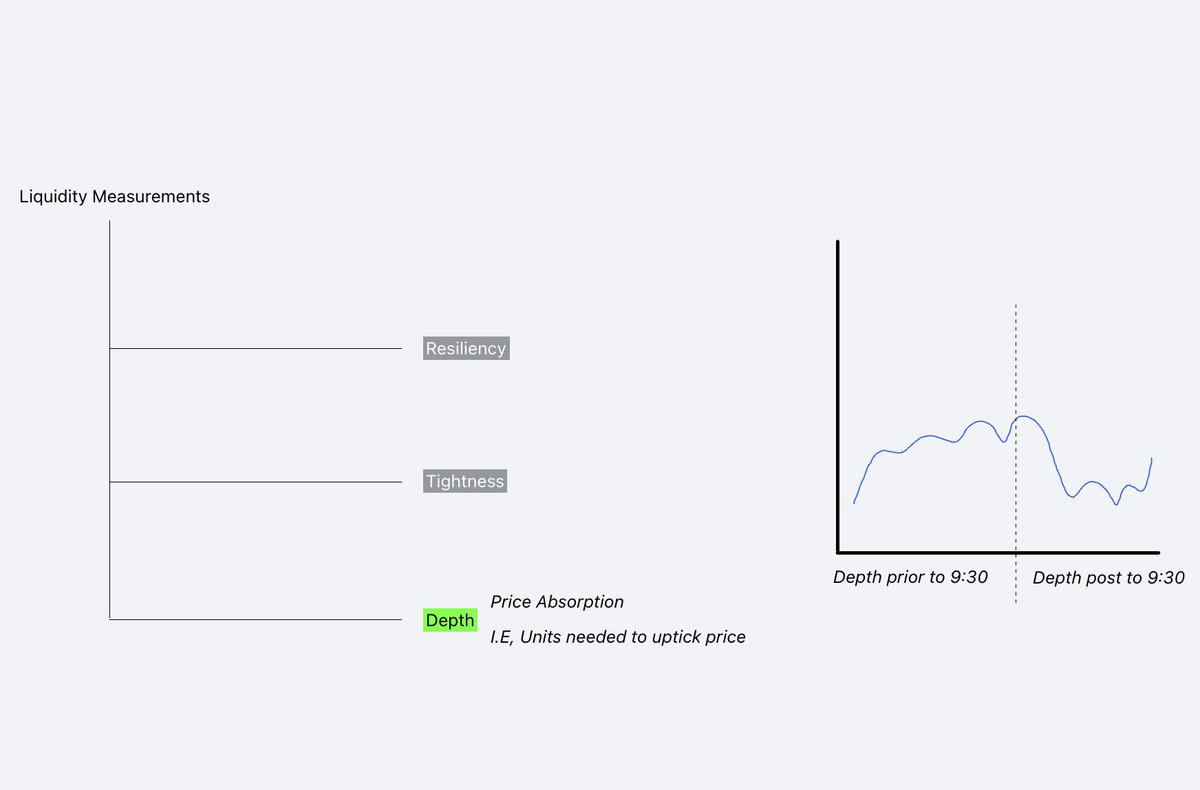
Market Depth as a liquidity measurement and a variable for Volatility
Contrary to my previous understanding,
According to 2021 Research in commodities and Futures markets
An increase in volatility may cause a reduction in depth, less participation from "informed" participants
Liquidity having multidimensional measurements, one of them being Depth
Depth represents the amount of "interest" in the marketplace built by limit orders
Those same limit orders that build depth, can also be broken down by either cancellations, or market orders that deal with the limit orders
A "lesser" depth may allow for easier uptick or downtick in price as the friction to the next price point may contain less of a "wall"
An interest of one directional movement may arise from a simple price discovery and order acceptance that may allow the one-sidedness
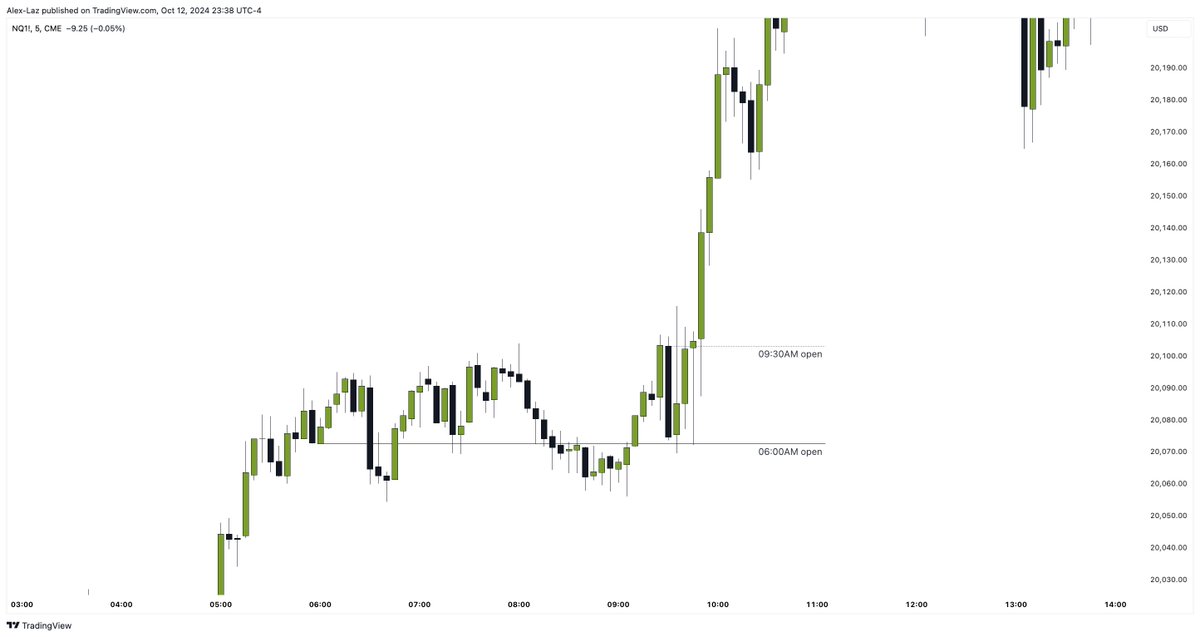
The assumption may be that during Regular trading hours, or at least at equities open, we can see an increase in participants
But this may be delayed as the high frequency order submission is determining order flow, depth, and acceptance towards the more "beneficial" premium or discounted market
Historical averages for themselves speak quietly
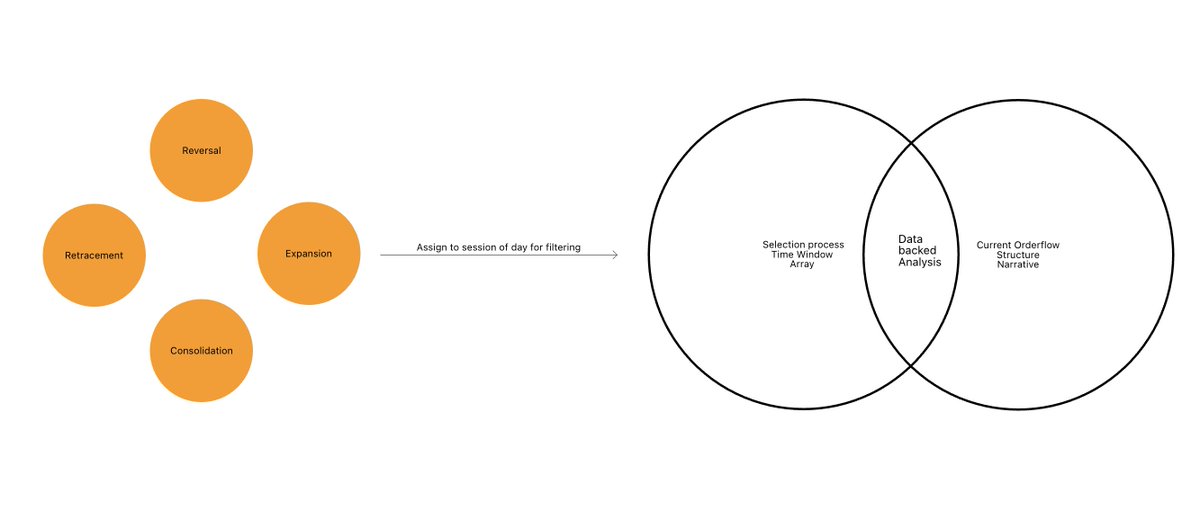
Creating a filtering process where you are able to assign a time of day to a specific definition of "movement" to price, allows for repetition of filtering
It's a conditional formatting
This is where you add your averages
Stop losing trades prematurely, understanding high impact news events & when to anticipate a Judas swing.
Here are the time windows to take into consideration to frame your trades.
When they’re high probability 👇
Forget all the PDarrays except for highs and lows.
One day, you'll believe me when I say you don't need these PD arrays, not even one of them.
Erase these from your brain:
OB, FVG, IFVG, BPR, BRKR, RB, MB etc.
Also, forget CISD (CSD), MSS, BOS, CHoCH, Fib, and STDv.
I guess I'm one of the few traders out there who have learned from ICT, but I don't use any of these PD arrays ever.
Focus on highs and lows and see how much easier everything will become for you.
You'll ask why this PDarray didn't work; they will tell you that you got the orderflow wrong because you got the time wrong because there was another OB there that you didn't see; the DOL was up and you got it wrong; why did you expect your BPR to hold? We had an IFVG"
And these kinds of hindsight BS.
An OB will work until it suddenly doesn't, and they won't even know why. Later, they will make up a story in their mind as the PA develops.
It's like a support and resistance trader... the support works seven times until it suddenly doesn't, and they don't even know why it did work and why it doesn't work anymore.
PS: not saying these concepts don't work at all.







![Alexxo's tweet photo. 9.24.24 [NQ] Journal
Visualizing the O[H]LC when bearish, under the requirement of a significant liquidity sweep, and an orderblock forming the high of the candle, creating the distribution
where distribution is now = to body of HTF candle https://t.co/397bi1BSqw](https://pbs.twimg.com/media/GYQwUmsXAAAHEMt.jpg)





