Introducing — Lighter Stats
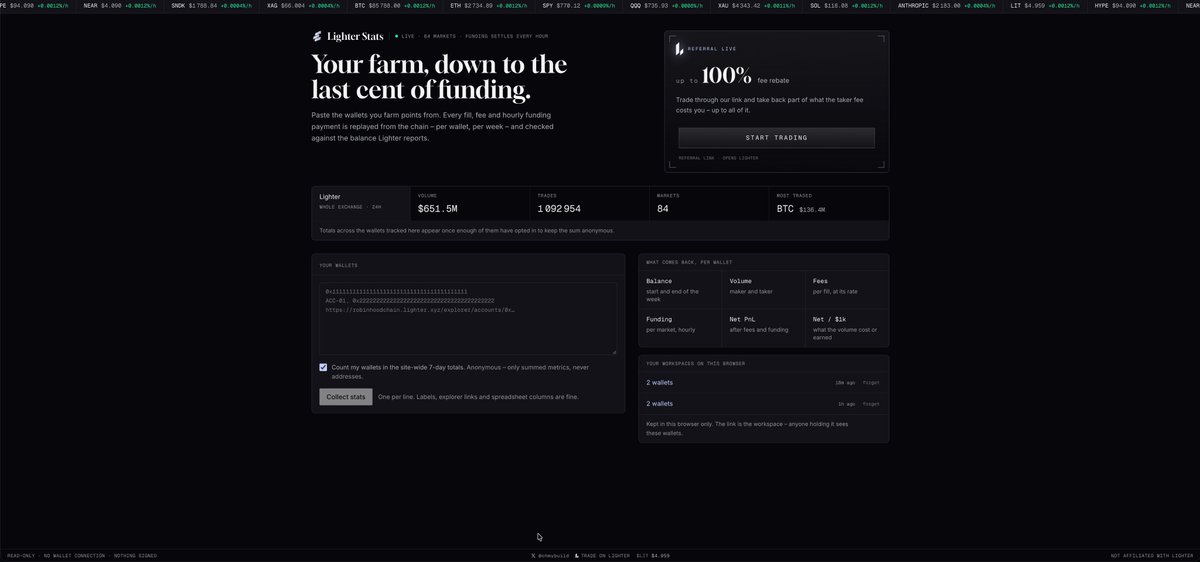
Your go-to tool for tracking vol, fees and overall activity in the new Lighter x Robinhood season.
Everything comes straight from the blockchain, so it's always up to date.
Add as many wallets as you want, all in one view:
- Net PnL, volume, fees & funding at a glance
- daily charts + trade heatmap by hour
- per-market and per-account breakdown
- CSV export
Fully private, even I don't really know what you're tracking there.
👇 Link Below
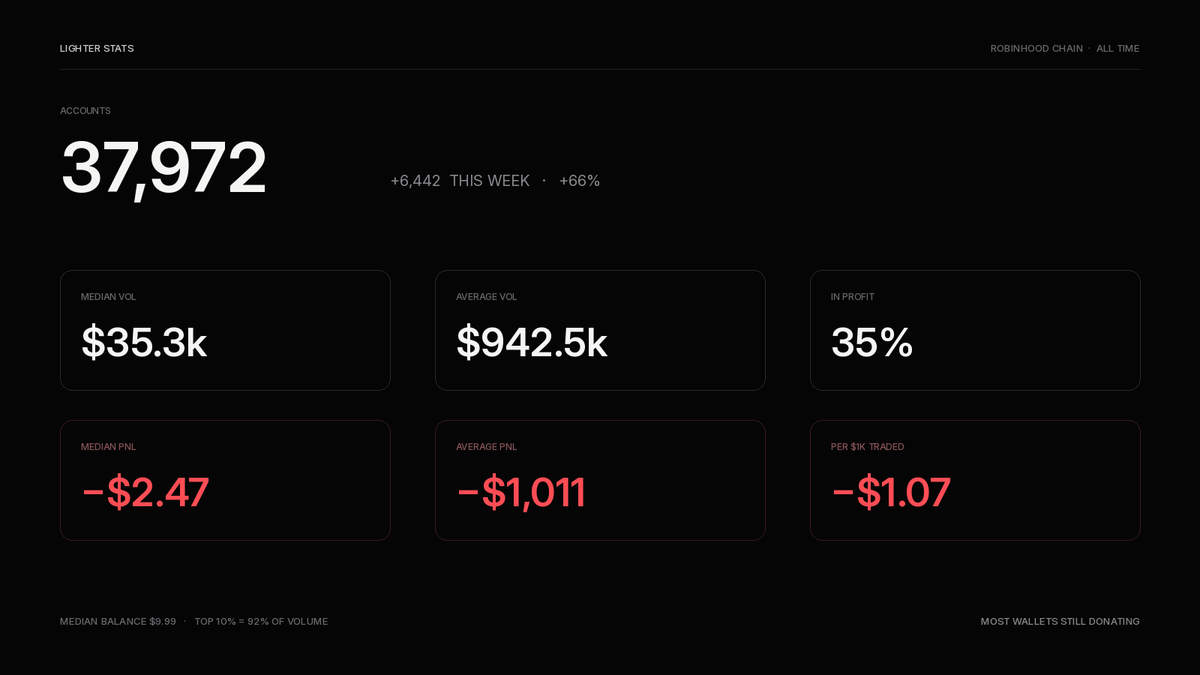
new page on Lighter Stats: every account on @Lighter_xyz Robinhood Chain
37,972 wallets. +6.4k this week. that’s +66%.
the typical account though:
> median vol $35k, average $942k
> median pnl −$2.47, average −$1,011
> only 35% in profit
> −$1.07 per $1k traded
> median balance $9.99
> top 10% do 92% of the volume
24h: $541m vol, $455m OI, 1.26m trades
46% of accounts even traded this week
farm is growing. most wallets are still donating.
👇 Link Below
RH Farming Lighter. This Week's Results
My cost per point this week was around $2.
In reality, it was closer to $3–$4, but some of my points came from referrals at no direct cost.
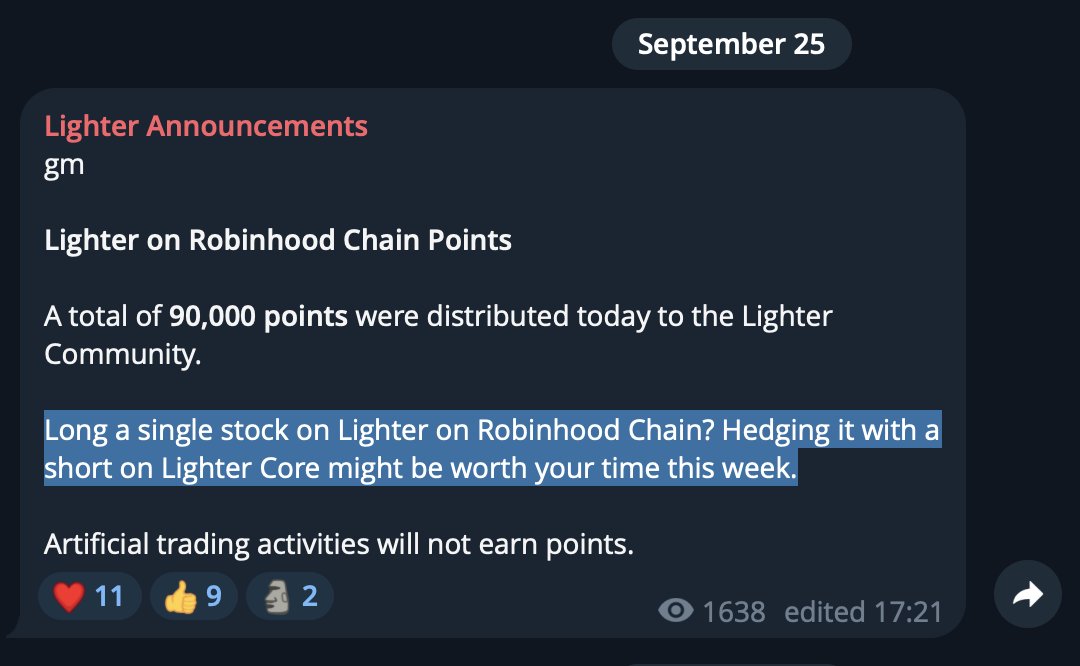
This week, bonus points are awarded for:
Going long on a stock on Lighter RH + going short on the same stock on Lighter Core to hedge the position.
Keep a close eye on price differences between the two platforms, as a large spread can cause unnecessary losses.
Tip:
You can conveniently track your wallet stats here:
https://t.co/t6WVOY0Czt
It's not too late:
https://t.co/fEj7GLzZdV
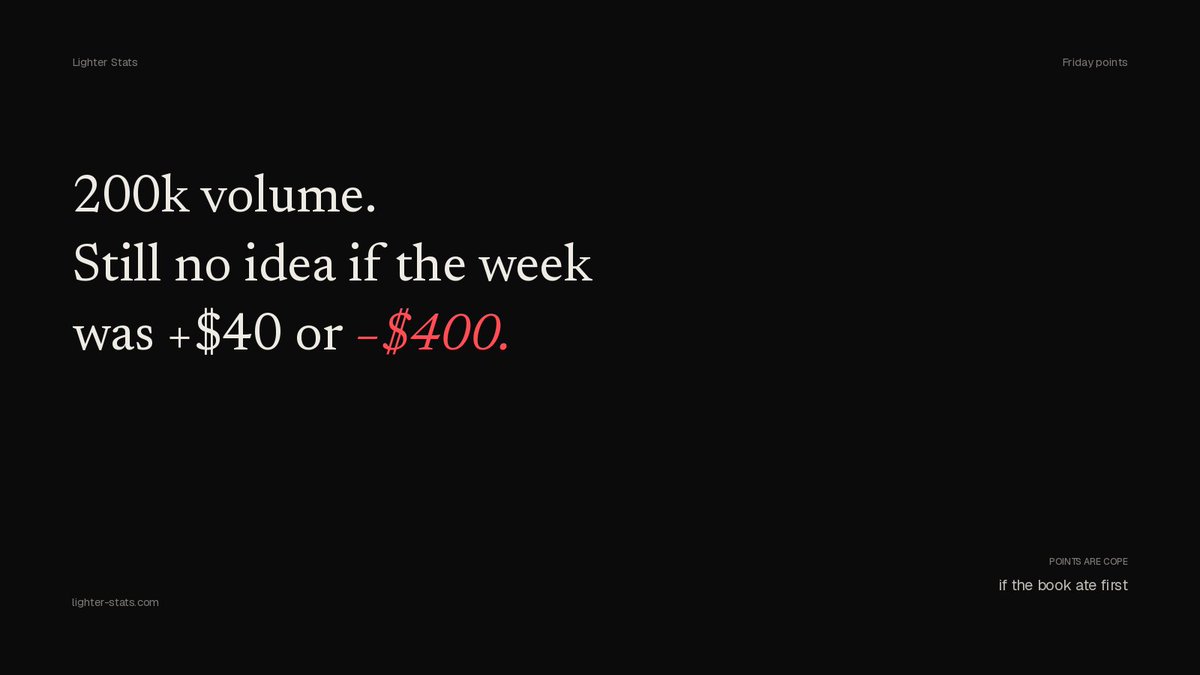
half the TL flexing Friday points with a straight face
brother you printed 200k vol and still don’t know if the week was +$40 or −$400
Lighter Stats will ruin that tweet
> which pair bled
> fees vs funding
> how long you actually held
> real pnl after the spread
points are cope if the book ate the bag first
@Lighter_xyz
👇 Link Below
Leaderboard says you cooked
Lighter Stats says you donated to the book
paste the farm wallets
vol / fees / funding / real pnl after the spread ate you
per acc, per pair
most people track points, almost nobody tracks what the points cost
👇 Link Below
@Lighter_xyz just distributed weekly points
got your drop and still guessing why it's 8 pts and not 80?
line the week up on Lighter Stats
> volume for the week (or any range)
> fees you burned
> funding
> how long you actually held
same ritual every Friday: check points, then check what you did. most people skip step 2
👇 Link Below
best call of the year dropped at 01:01:
"URGENT bitget promo dump any coin loot 2% a day on size"
51 mins later at 01:52:
"fuck they hacked bitget sorry for the fake alpha. -370k that I deposited. praying they send it back"
call of the year. aged 51 minutes
🚨 @bitget looking cooked rn
>$180M just yeeted from labeled hot + cold wallets across chains to one fresh addy in like an hour. Onchain is screaming
Withdrawals already looking paused. Classic CEX moment
NYKNYC still undefeated
https://t.co/IwQsgWkJOh
tomorrow @Lighter_xyz drops weekly points
y’all ready or still staring at the leaderboard like it explains anything
volume / fees / funding / PnL for the week is already sitting here
https://t.co/dKrTlQQFQw
paste the wallets before the number hits. at least you’ll know what you actually farmed, not just what they paid you for it
New tab on Lighter Stats: Markets
57 perps. one line each. what $1k of hedge actually costs in the book at your size.
> drag the pair from $1k to $100k and watch the cost move
> live Lighter books over websocket, not a screenshot from 4 hours ago
> open a row and you see your two orders sitting in the stack: how far the buy walks, how far the sell walks
> “holds under $0.10” = how big you can go before the pair stops being cheap
> price, 24h vol, OI, funding so you know what leaks between wallets overnight
SPY at a $10k pair is $0.047 per $1k right now
fees left out on purpose, they’re the same on every market. this is just the book eating you.
if you’re still picking pairs by vibe, this page is gonna hurt a little. that’s the point.
https://t.co/dKrTlQQFQw
@Lighter_xyz
Shipped pair cost anatomy on Lighter Stats
You know the volume. This shows which pairs actually bled
> ranks every pair best to worst by cost per $1k
splits the damage: fees in, fees out, spread, funding
> limit vs market so you see why one pair was cheap and the other got cooked
> flags the fumbles: naked leg, half hedge, both sides the same way
If you're pairing SPY QQQ ETH all day and still guessing where the fees went, just paste the wallets. a lot more in there than this screenshot
https://t.co/dKrTlQQFQw
@Lighter_xyz@RobinhoodApp