Silver dropped almost 50% from June 1968 to November 1971, and then rallied ~420% into February 1974.
Silver then dropped ~43% into 1976 and then rallied ~1150% by January 1980.
Silver dropped 60% from March to October 2008 and then rallied ~490%.
Gold dropped almost 30% in late-1973 and then rallied almost 100%...and then dropped ~25% and then rallied another 45% all by January 1975.
Gold dropped 50% in 1975 and 1976 and then rallied ~770% by Jan 1980.
Gold dropped ~26% in 2006 and then rallied 90%.
Gold dropped ~35% in 2008 and then rallied 180%.
This sell-off since January 2026 is now the third largest silver has ever had within the context of a bull market, and for gold it's the the fourth largest...almost on par with the 1973 correction and nearly on par with the Great Financial Crisis. In terms of time from top to bottom, this is more akin to the 1973 correction (about 20 weeks) or 2006 (about 20 weeks).
All of these drops led to enormous V-bottom rallies, some so rapid that if they repeated today it would mean $8000+ gold by October.
@RostronE@BradHuston Oh it’s cool, he can think whatever he wants to think about us. We aren’t sponsored by anyone, we don’t “push” anything, we’re not selling coins or bars, but we get called “pumpers” whenever there’s a drawdown 🙄
@RostronE@BradHuston We receive max hate whenever there’s a retrace in metals. Whether we predicted it or not. It’s a good contrary metric and it is pretty much at 11 right now.
@alamo23445@mothersilverape Our long term target for this bull market was always 8k gold and 200 silver at bare minimum as the ultimate, peak price. We weren't "calling" for it to occur in 2022 necessarily, even though we've been stating it for years as the *ultimate* target (or higher) of this bull run.
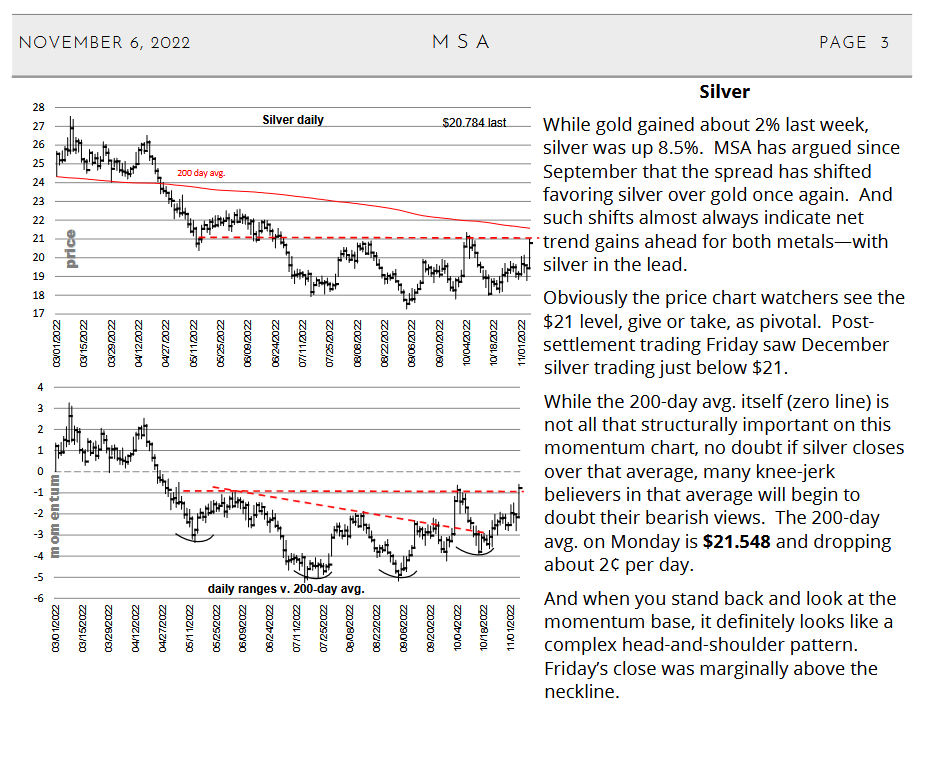
And what were we looking at in November 2022, at the bottom? While many were still seeing further lows ahead (as is typical at bottoms, when everyone is maximally bearish), we saw clear structure to go up on. Structure that had been building for months. Much like right now: we see clear structure on several different momentum oscillators that's been building for months, waiting to be exploited on the upside.
The warning was at $23, not $22, and we're not going to "warn" of anything unless something structural actually breaks. Silver dropped to $17, not $18, which was a 24% further drop from where we warned it was going south. We are neither a short-term nor a day trading service. We aren't here to scalp tiny percentages. We are here to catch the big moves, like the major upside that followed from our much later signals in March 2024 at $25 and June 2025 at $35.
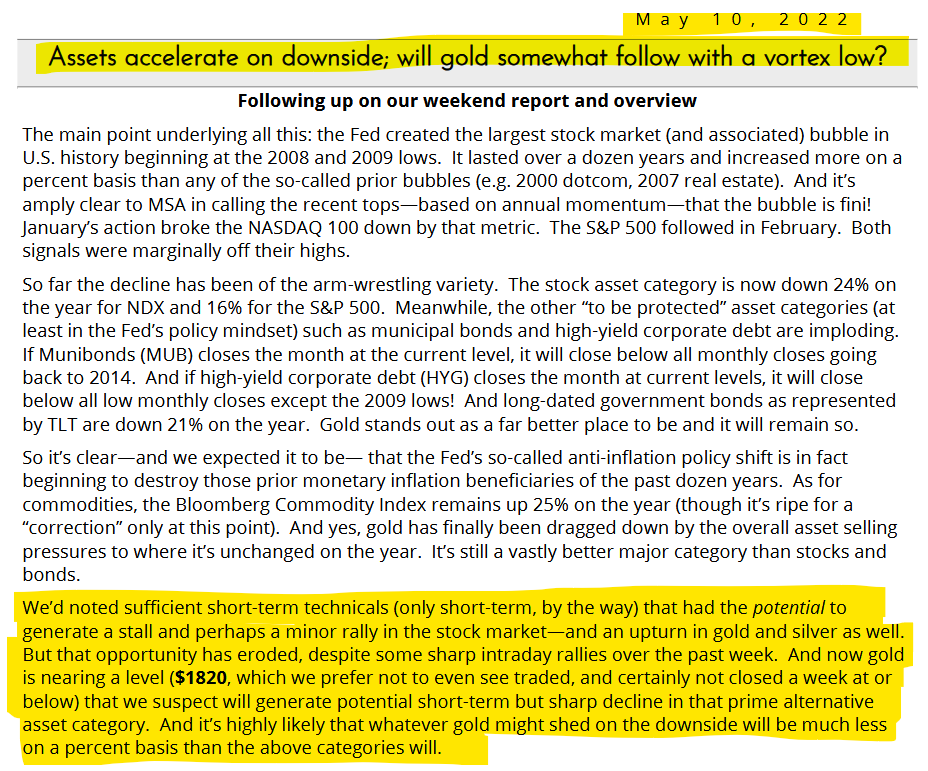
Yeah, we know, plenty of trolls like to say that MSA "never warned anyone about what happened in 2022 to the metals." OK, well, here's some snippets from reports in May 2022 where we acknowledge a failed breakout and explain that we could see the metals get dragged down with the stock market.
Technical Analyst and Market Strategist Michael Oliver says everyone is watching the Iran war, but the real crisis is already forming inside the U.S. bond market, and when it breaks, it could hit everything.
For decades, investors have treated U.S. government bonds as the safest asset on Earth.
Michael says that assumption is beginning to crack.
He argues the real crisis isn't inflation, it isn't recession, it isn't even the Middle East.
It's the growing possibility that confidence in government debt starts to break down.
If that happens, the Federal Reserve will have to create even more money to support the bond market.
And he believes investors are already starting to prepare for that shift by quietly moving into real assets: gold, oil, industrial commodities, and agriculture.
Assets that can't simply be created with another round of monetary expansion.
He also pointed to something that rarely gets discussed.
The biggest bubble is the belief that government debt will always remain the world's safest investment.
If that confidence disappears, the consequences won't stay inside the bond market; it will ripple through virtually every corner of the financial system.
Most of the world is focused on the next missile strike on Iran, but he's watching the next Treasury auction.
Because in his view, history won't remember the Iran war as the event that changed the markets.
It'll remember it as the distraction that kept everyone looking in the wrong direction while the real crisis was gathering underneath their feet.
@Oliver_MSA
@styrstroem The London Gold Pool was formed in the 1960s with the explicit purpose of suppressing the price by dumping physical reserves into the open market. It failed in 1968. Then the US Treasury and the IMF dumped physical holdings throughout the 70s with the same goal. That also failed.
Silver dropped almost 50% from June 1968 to November 1971, and then rallied ~420% into February 1974.
Silver then dropped ~43% into 1976 and then rallied ~1150% by January 1980.
Silver dropped 60% from March to October 2008 and then rallied ~490%.
Gold dropped almost 30% in late-1973 and then rallied almost 100%...and then dropped ~25% and then rallied another 45% all by January 1975.
Gold dropped 50% in 1975 and 1976 and then rallied ~770% by Jan 1980.
Gold dropped ~26% in 2006 and then rallied 90%.
Gold dropped ~35% in 2008 and then rallied 180%.
This sell-off since January 2026 is now the third largest silver has ever had within the context of a bull market, and for gold it's the the fourth largest...almost on par with the 1973 correction and nearly on par with the Great Financial Crisis. In terms of time from top to bottom, this is more akin to the 1973 correction (about 20 weeks) or 2006 (about 20 weeks).
All of these drops led to enormous V-bottom rallies, some so rapid that if they repeated today it would mean $8000+ gold by October.