who gives a fuck about a token paired to NVIDIA?
the real question is, when are we going to get a memecoin paired to a penny stock and then onchain activity leads to that stock going up 100-200%
would be the biggest story in TradFi
Kevin Warsh will be sworn in this Friday as the new Fed Chair
Current Fed rate: 3.50–3.75%.
Next meeting: June 16–17.
CME FedWatch: probability of a 25bps rate hike by December jumped to 37.4% vs just 0.5% a month ago.
US inflation picked up again: April CPI hit 3.8% YoY, core inflation at 2.8%.
Investors used to expect rate cuts and cheap money.
That logic is shifting. Oil, inflation and rising bond yields are forcing markets to price in a scenario where the Fed hikes again instead of cutting.
The Clickbait Is the Product
AshCrypto, Crypto Rover, Sweep, Jeremy, Mario Nawfal, MM Crypto. None of them are traders. They're content creators.
That rocket emoji? Not a mistake. That's the plan. "BITCOIN ABOUT TO DO SOMETHING CRAZY" gets 10x more clicks than "honestly no idea." The algorithm rewards clicks, not accuracy.
So everything stays bullish. Always urgent. Always "you'll miss out." They run media businesses. Your attention is the product. The chart is just the costume.
Why do you even follow them? What are you getting. Signal?
A new coin to my watchlist: $XLM, @StellarOrg
One of the older crypto projects slowly getting market attention again.
Stellar is a blockchain focused on fast and cheap payments between people, banks, and payment systems.
Main goal: make global transfers easier, faster, and cheaper.
What $XLM has:
- launched in 2014
- own blockchain
- very low fees
- fast transactions
- focused on payments
- partnerships with financial companies
- strong payment infrastructure + RWA narrative
Stellar was created by @JedMcCaleb, one of Ripple’s co founders.
Right now meta on:
- RWA
- payment infrastructure
- tokenization
- crypto integration with traditional finance
Stellar sits directly in that sector
$XLM already has a massive mcap, so this is probably not a “100x” play. It’s more of an infrastructure coin with slower but more stable upside compared to small caps. But these older projects often come back late in the cycle.
Total supply: 50B XLM
Circulating: ~33.5B
Mcap: ~$5.5B
Launch: Aug 2014
🔗 https://t.co/iQ0ZR4aPjc
🔗 https://t.co/lEIU8aTsx1
🔗 https://t.co/yE4Yuml2DA
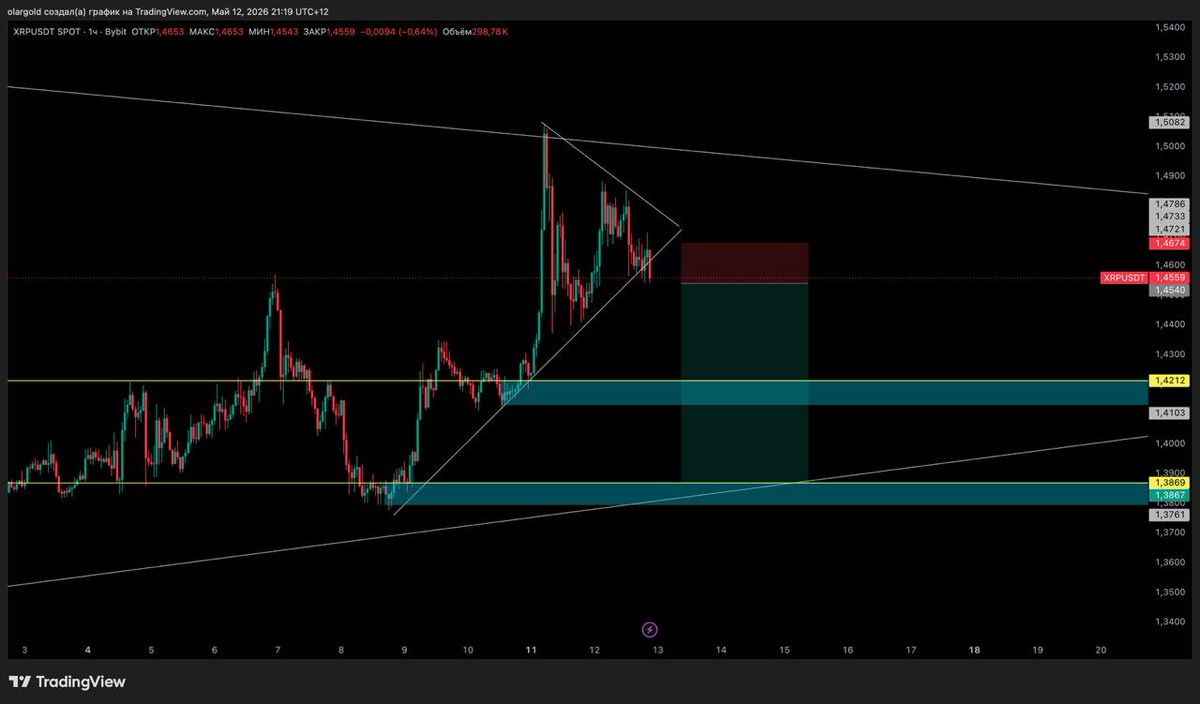
$XRP my setup: coin pushing above the trendline. If the level breaks, I’m looking at a short, toward the lower trend boundary inside the triangle.
Targets: 1.4212 / 1.3869
Invalidation: break above the local trendline.
OTC crypto trading hit $478B in volume in 2024
Growing 24.8% year over year.
P2P OTC specifically up 313% in a single year.
And yet every single platform handling this volume is centralised. Custodial. Gated behind KYC and minimum deal sizes.
The decentralised layer for OTC doesn't exist yet. Until now.
https://t.co/iIfGT0x66L
$BTC: Daily Fib Targets (Downside)
Current downside levels: 74,030 / 72,359 / 70,700
If trendline breaks down: 65,280 - strong level, aligns with the global multi-year ascending trendline
If that multi-year trendline breaks (could see a fast impulse bounce first)
61,430
59,800
56,530
51,430 (extreme edge)
Gm, we are a community of female traders, journaling on X our setups and ideas! Here's today's setup:
$BTC liquidity taken from the same high around $79k, then price dropped to the lower boundary of the local trend.
I’m watching a break of this trendline.
If we get a 1H close below, targets are: 75 870 / 73 845 / 72 846 / 69 850
April 29 decision on the new Fed Chair. Depending on the candidate, the market will price in expectations until the official start (around May 15, NY time).
Let’s see how it plays out and have a bullish week man
Polymarket TGE coming soon
Reminder: it’s a prediction platform, not a trading one.
They’re pushing for mass adoption.
Now you can enter via the Putin's Max messenger 😂 (Gamble carefully cuz KGB always watching you)
No need to file taxes until Dec 1. Fees are taken automatically after each bet.
Everything is compliant. And you can chat inside Polymarket without VPN, unlike Telegram or Instagram.
Watch for $POLY
The real $BTC bottom in a bear market usually forms below mining cost
purple line — cost to produce 1 BTC (~$74.6k)
red line — electricity cost (~$44.7k)
When price drops below production cost, miners about to capitulate. This is happening now. In Q1 2026, miner selling already exceeds total sales from last year.
Rn, the pain zone for miners is around $74k. But historically, the market doesn't stop there. In past cycles, price moved lower, closer to electricity cost. Sometimes it even dipped below.
If the same pattern repeats, a potential bottom could form closer to the ~$44k range.
$RIVER Interesting take
On TradingView and Bybit (laptop), the Wolfe pattern already played out. Price bounced from the 4.5 zone as expected. That gave long signals and mid term targets.
But on tradingview from desktop, it looks different.
The “fifth point” is not fully reached. The Wolfe line points lower, toward $2. This is also a past accumulation zone, which makes current longs less clear.
So the question is: which chart should we trust?