Most traders use RSI the conventional way.
I prefer using it as a trend strength indicator. 📈
📌 My simple RSI framework:
🟢 Above 60 → Bullish momentum
🔵 40–60 → Consolidation / Sideways
🔴 Below 40 → Bearish momentum
For swing trading, I focus on stocks where:
✅ Weekly RSI > 60
✅ Price respects the 21 EMA
✅ Daily RSI pulls back to 40 or holds above 60
✅ Price action confirms the entry
Don't ask, "Is RSI overbought?"
Ask, "How strong is the trend?"
That's where the real edge lies.
🔖 Bookmark this RSI guide for your next chart review.
Follow @ChartMantra_ for practical price action, RSI insights, and daily trading lessons.
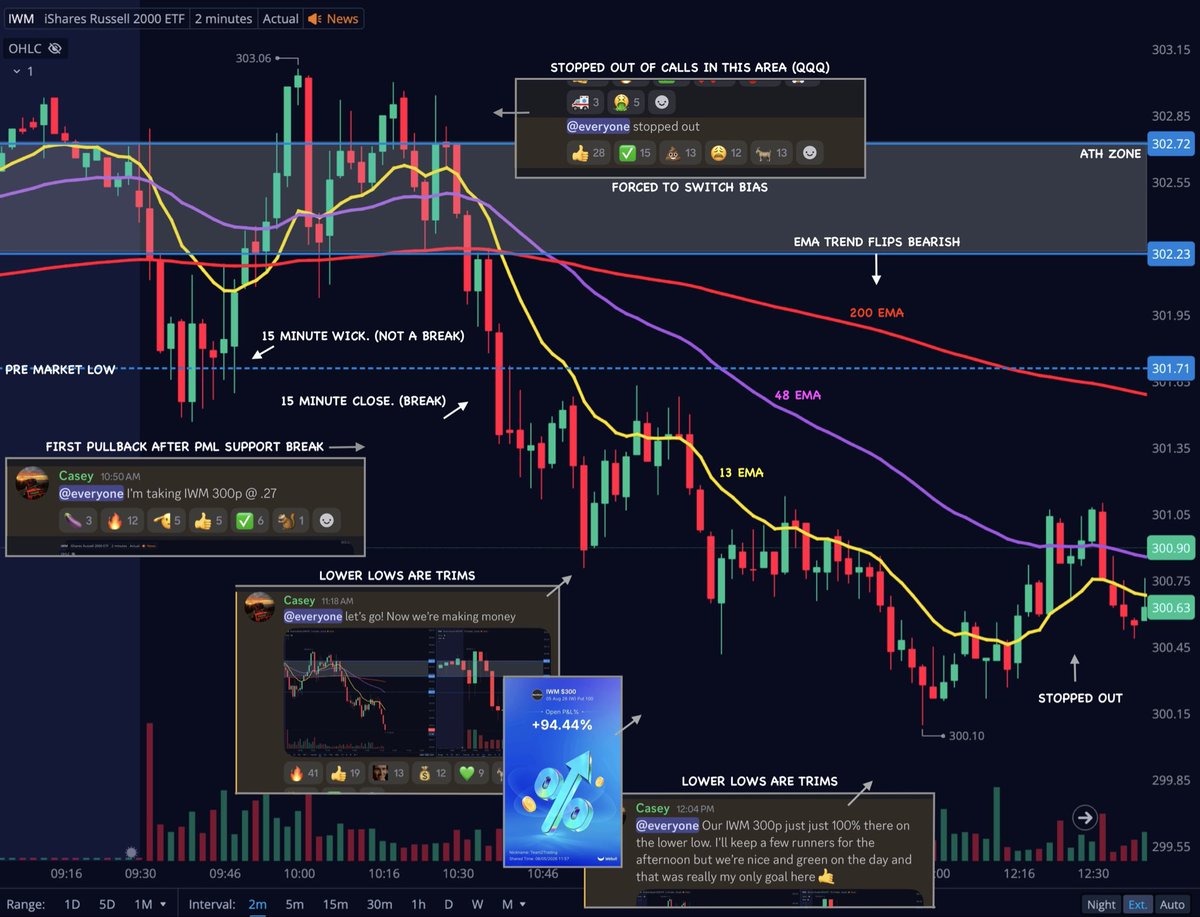
Tips that help me flip bias when I’m on the wrong side of the move 📝
• When a breakout fails. It’s typically fails hard so I try to keep that in mind.
• When the EMA trend flips from bullish to bearish. Flip with it.
• When the pre market low breaks. There is no longer a reason to be fighting the trend and looking for calls.
Starting out the day on the wrong side of the move is never fun! But these tips usually have me back on track by days end.
Hope it helps 🤙
🚨DAILY BIAS GUIDE – SMC EDITION 👀👇
✅ Price Range = Foundation of Your Bias
✅ Bullish Bias = Price Trading Above Key Range
✅ Bearish Bias = Price Trading Below Key Range
✅ Avoid Trading in Choppy / Indecisive Zones
✅ Use "Hand Rotation" Logic – Shift Bias When Structure Breaks
✅ Natural Hand Woting = Follow the Flow, Not the Noise
✅ Bearish Candle Range = Potential Resistance for Shorts
✅ Bullish Candle Range = Potential Support for Longs
✅ Always Align Your Trades with the Daily Bias First
📌 Tip: If price is inside the range – WAIT. If it breaks & retests – ACT.
I tested every indicator for 10 years:
MACD, Bollinger Bands, Stochastics, Fibonacci, Volume Profile, Order Flow...
After $83K in losses, I only use TWO:
1. RSI (tells me when to enter)
2. Moving Averages (tells me the trend)
That's it.
Everything else is noise.
My 3-rule system for 95% win rate:
Rule 1: Only sell puts on red days (RSI <50)
Rule 2: Target 5% return in 30 days
Rule 3: Close at 50% profit (5-7 days)
Simple systems win.
Complex systems lose.
Every time.
HOW TO STOP LOSING
You keep buying after the trend has already changed
$SMH is a perfect example. This is how we saw leaders like $NVDA and $INTC become weak EARLY
Higher Highs + Higher Lows = Stay long
Lower High + Lower Low = Trend change
Save this. You’ll use it forever.
The 21 EMA isn't just a moving average.
It's where many of the best low-risk entries begin. 📈
Most traders chase breakouts.
Experienced traders wait for the breakout to come back to them.
My ideal 21 EMA pullback checklist:
✅ Weekly RSI > 60
✅ Price above 50 & 200 EMA
✅ Pullback into the 21 EMA (dynamic support)
✅ Volume dries up on the pullback
✅ Bullish reversal candle + buying volume returns
That's where probability shifts in your favor.
🚫 Avoid these mistakes:
❌ Buying 8–10% above the 21 EMA
❌ Ignoring volume during pullbacks
❌ Treating the 21 EMA as an exact line instead of a support zone
❌ Forgetting risk management
📌 One lesson that changed my trading:
The market pays you for patience, not for chasing.
The best traders don't buy because price is moving.
They buy because risk is low and the setup is complete.
💬 Question for you:
Do you prefer entering on:
1️⃣ Breakout
2️⃣ 21 EMA Pullback
3️⃣ Retest of Breakout
4️⃣ VCP Breakout
Comment your choice below. 👇
❤️ Like • 🔁 Repost • 🔖 Bookmark this note for your next trade.
Follow @ChartMantra_ for daily trading notes, practical price action lessons, and high-probability swing trading strategies.
$SPX weekly MACD is about to cross bearish.
These don't always matter, but when they have, they've really mattered. Two bear markets and two corrections started with this signal.
Worth being aware of.
🚨 MY 2026-2027 MARKET ROADMAP:
JUL → Blow-off rally
AUG → Bull Trap sets in
SEP → Panic spreads
OCT → Capitulation hits
NOV → Cycle low forms
DEC → Accumulation phase
JAN → Bull trend returns
Many traders believe $SPX rally still has room to run...
But multiple key signals suggest a very different outcome
A major market sell-off could hit at any moment - don't become exit liquidity for smart money
Turn notifs on so you don't miss best market calls...
🚨Warning, this pattern signals a massive crash.
This pattern has NEVER failed.
1999 → 50% cash
2007 → 60% cash
2016 → 60% cash
2026 → 75% cash
EVERY TIME Buffett moved into cash, markets crashed after.
→ 1999 crash: 49%
→ 2007 crash: 58%
→ 2016 crash: 22%
→ 2026 crash: **%
Warren Buffett warns: the market has turned into a casino again.
Berkshire has already accumulated $397 billion in cash.
This is the signal that another MAJOR CRASH is coming.
Be careful with your investments in the near future.
Follow and turn notifications on.
I'll post the warning BEFORE it hits the headlines.
We have reached the time of year that the Volatility Index typically bottoms following the summer rally timeframe; gains are the norm through the remainder of the third quarter. While we are tracking the risks in this market, we are not seeing a setup akin to past volatility spikes/equity market weakness. We have stayed with our heightened equity exposure that was enacted following the “June swoon”. $VIX $SPX
HOW TO REDUCE "FEAR" IN TRADING
✅ Back-test to Your Trading Strategy
✅ Journal Your Trades & Review
✅ Have a Trading Plan and Stick to it
✅ Smaller Position Size
✅ Embrace Your Losses
✅ Focus on the Process not the Outcome
🚨WARNING: SOMETHING EXTREMELY BAD IS COMING!!
History is repeating itself again.
Every Bitcoin cycle followed the exact same script.
2018
→ ATH: $19K
→ Bottom printed
2022
→ ATH: $69K
→ Bottom printed
2026
→ ATH: $126K
→ The final bottom is forming now
Most people are waiting for confirmation.
They always do.
But by the time the bottom becomes obvious, the biggest opportunity will already be gone.
Everyone will say:
"Bitcoin is dead."
They always do.
This is how every major Bitcoin bottom has formed.
Follow and turn notifications on.
I'll post the exact moment I start loading spot.
MY PORTFOLIO WAS DOWN 70%. I CALLED THE ONLY PERSON I TRUSTED.
He picked up on the first ring. Didn't ask what happened.
Just said: "Open your notes. Write this down."
Price falls 5% → Hold
Price falls 15% → Buy 10%
Price falls 25% → Buy 20%
Price falls 40% → Buy 30%
Price falls 60% → Buy 40%
Price rises 5% → Hold
Price rises 20% → Hold
Price rises 25% → Sell 10%
Price rises 40% → Sell 20%
Price rises 50% → Sell 35%
Price rises 70% → Sell 40%
Price rises 100% → Sell 90%
Always keep 10% as a moonbag
Never go all in, never go all out
That call cost me nothing.
Not following it earlier cost me everything.
Follow me - the people who do tend not to regret it
🚨MORNING GAP STRATEGY 👀👇
The Setup (Overnight);
1️⃣ Stock gaps down >5% at open
2️⃣ First candle shows HEAVY buyer pressure
3️⃣ Price consolidates near the open
The Entry;
4️⃣ Break above first candle high → re-test that level
5️⃣ Successful re-test = ENTRY (new support confirmed)
The Target;
6️⃣ Take profit when the gap fills
THE EDGE;
Patience. Wait for the re-test. The trap becomes your entry.
Gap downs with strong buyers = reversal fuel.
Save this. Trade it.