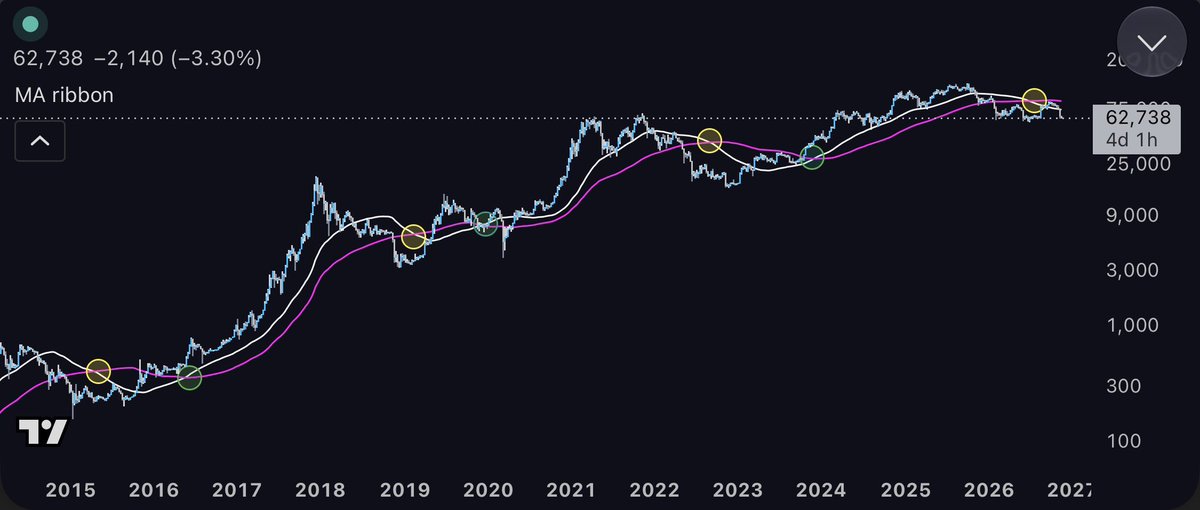
$BTC 3 D
The cross has occurred on the back of a major capitulation.
The 50day & 100day only cross at the pico bottom or pico top.
The top is in😂✍🏻
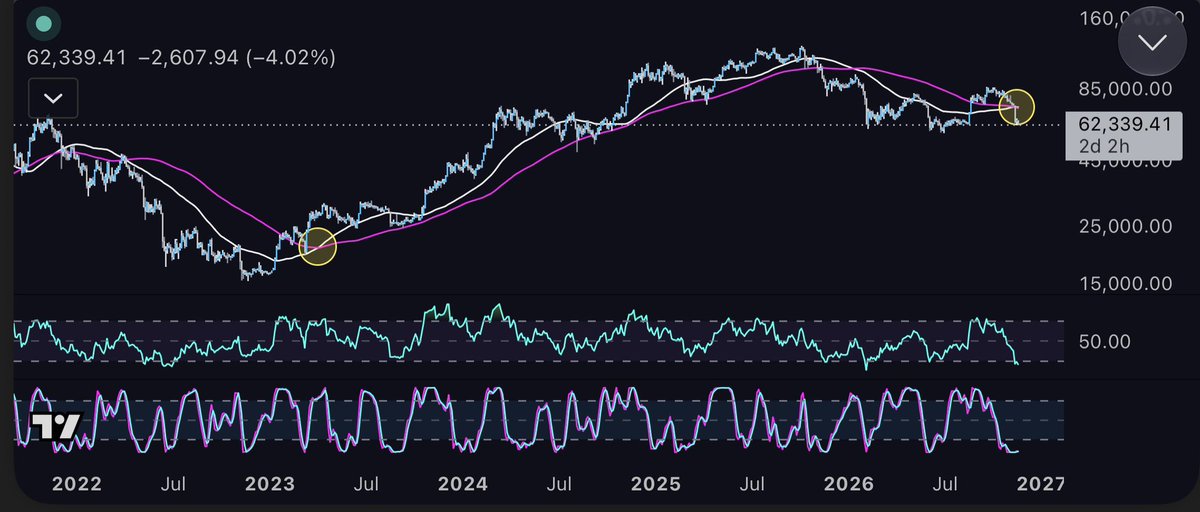
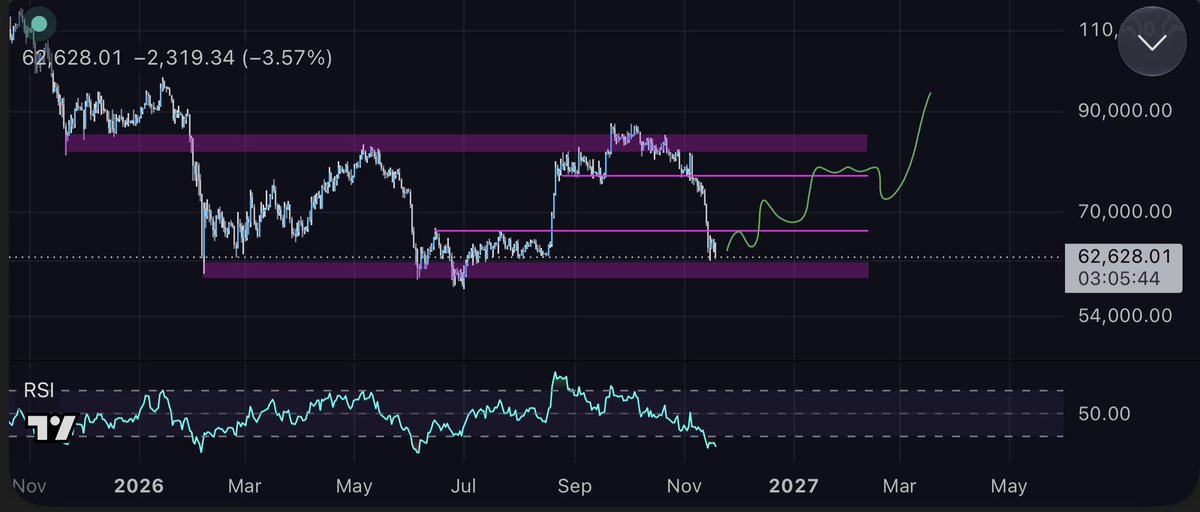
$BTC 3 D
The cross has occurred on the back of a major capitulation.
The 50day & 100day only cross at the pico bottom or pico top.
The top is in😂✍🏻
😈I think people are seriously underestimating what could be developing here😈
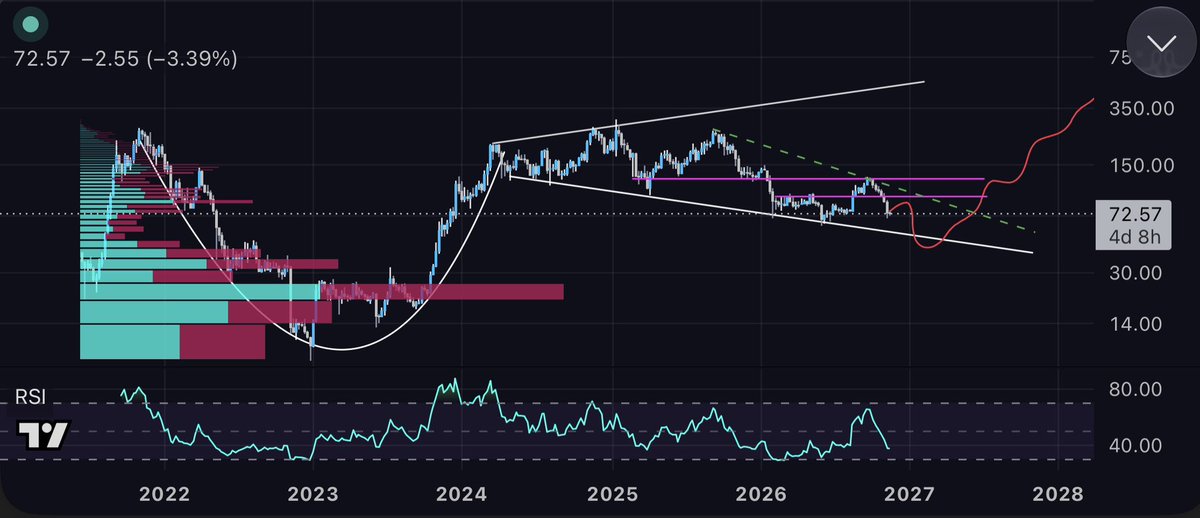
Solana has been trading within a massive multi-year megaphone pattern and we’re now approaching the lower boundary of that structure.
But what really has my attention is the potential nested descending wedge developing inside the larger megaphone.
A bullish reversal pattern potentially forming within an even larger bullish macro structure✍🏻👀.
I wouldn’t be surprised to see one final move lower, sweeping liquidity around $60–$70, shaking out the remaining weak hands before a much more aggressive reversal takes shape.
The RSI is also approaching levels that have historically presented some incredible buying opportunities.
Here’s where things get interesting.
If we can reclaim $90–$100, break out of the descending wedge, and eventually recover the major resistance around $120–$130, the entire technical picture starts to change.
At that point, I think a move toward the upper boundary of the megaphone, potentially $300–$350+, becomes a very real possibility over the longer term.
That’s a massive move from current prices.
Now, I’m not saying the bottom is in. We could absolutely see another leg lower, and a breakdown of the larger structure would force me to reassess this thesis.
I’ve been trading crypto for nearly a decade, and one thing I’ve learned is that the market has a remarkable ability to convince everyone the opportunity is gone right before the next major move develops.
The sentiment is terrible. Momentum is weak. Most people have completely written off the possibility of another major altcoin expansion.
Meanwhile, SOL is potentially building one of the more interesting higher-timeframe reversal structures I’ve seen in a while.
I’m paying very close attention to this one.
$SOL (weekly)
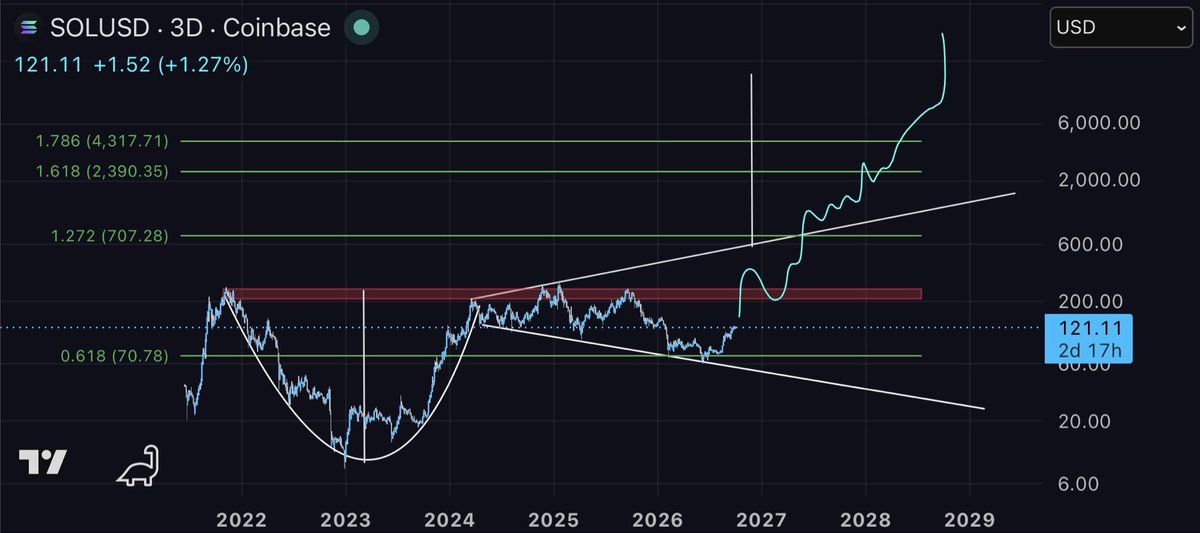
$SOL 🚨I THINK PEOPLE ARE SERIOUSLY UNDERESTIMATING HOW HIGH THIS STRUCTURE CAN GO🚨
Everyone talks about $300, $500, maybe $1,000 SOL.
But zoom out to the log chart and there are multiple independent technical structures suggesting the long term ceiling could be dramatically higher👀
The log Fib roadmap gives us:
1.272 → ~$707
1.618 → ~$2,390
1.786 → ~$4,318
Then we have an entirely separate structure.
The massive expanding megaphone has continued widening for years. Depending on where SOL eventually breaks the upper boundary, its measured move starts putting $5K–$6K SOL into play.
And then there is the monster hiding in this chart:
The multi year cup.
This is NOT a Fib target.
Measure the depth of the entire cup from the 2021 highs down through the 2022–23 bottom, then project that move above the neckline on the log chart.
The full measured move approaches $16,000 SOL.
That doesn’t mean SOL is going straight to $16K, and it certainly doesn’t mean every target gets hit this cycle.
It means the structure gives us a roadmap:
$707 → $2,390 → $4,318 → $5K–$6K → ~$16K measured cup target.
And the technical picture is developing while Solana itself is becoming increasingly important infrastructure for stablecoins, payments, tokenized assets and on chain capital markets.
That’s what makes this chart so interesting.
The Fib extensions, megaphone and cup are three different technical measurements, yet all of them argue that SOL’s potential price discovery range is considerably larger than the market is currently pricing.
$16K sounds ridiculous at $121.
Most exponential moves do before they happen.
Save this chart.
🚨🤓READ🤓🚨
Bitcoin miners are facing a double whammy, and I think what’s happening beneath the surface deserves a lot more attention.
Historically, this is the stage of the Bitcoin cycle where mining economics become increasingly difficult. Following the halving, block rewards are cut in half, competition remains elevated, and declining BTC prices put enormous pressure on operating margins.
We’re seeing that play out again.
According to CoinShares, the average cash cost to produce one BTC among publicly traded miners reached approximately $75,500 in Q2 2026, while Bitcoin finished the quarter near $58,400.
For many operators, the economics simply don’t work.
But unlike previous cycles, there’s another major variable: AI.
Bitcoin miners have something AI companies desperately need… access to enormous amounts of electricity, existing grid connections, land, and infrastructure.
And increasingly, miners are discovering that their power capacity may be worth more supporting AI workloads than mining Bitcoin.
This is creating an unusual dynamic.
Miners aren’t just capitulating because Bitcoin is becoming temporarily unprofitable. Some are actively transitioning away from mining altogether.
Fidelity addressed this in its 2026 outlook, suggesting that the most likely outcome could be a combination of higher Bitcoin prices and lower network hash rates, allowing mining economics to naturally recalibrate.
Think about the implications💭…
As inefficient miners shut down and others redirect capacity toward AI, competition for Bitcoin block rewards can decline.
Bitcoin’s difficulty adjustment eventually compensates for reduced hash power, improving the economics for miners who remain operational.
Now consider what happens when Bitcoin enters its next major expansion💭👀🚀…
Higher BTC prices, potentially lower competition, and a mining industry that has already undergone significant consolidation.
That’s an interesting setup for the surviving operators.
But there’s another side to this story that I find equally fascinating.
AI infrastructure isn’t cheap.
Converting mining infrastructure into AI grade facilities can cost approximately $8 million to $15 million per megawatt, compared with roughly $700,000 to $1 million per megawatt for Bitcoin mining infrastructure.
These projects also face enormous capital requirements, lengthy construction timelines, grid constraints, regulatory uncertainty, and growing political resistance surrounding electricity and water consumption.
And despite more than $100 billion in announced AI/HPC contracts across publicly traded miners, much of that contracted capacity has yet to generate revenue🤷🏽♀️.
What happens if AI infrastructure becomes oversupplied? What if returns disappoint, financing becomes more expensive, or construction delays make these projects less attractive than originally anticipated?
And what happens if Bitcoin doubles or triples in price while some of these companies are still trying to complete their AI transitions?
Mining could suddenly become significantly more attractive again.
Of course, companies locked into long term AI contracts aren’t simply going to reverse course overnight. But operators that retain flexibility could redirect future capital toward whichever business offers the better return.
My thesis is that we’re witnessing two forces converging…
1) A cyclical capitulation driven by Bitcoin’s historical mining economics, and 2) a structural redistribution of energy infrastructure driven by AI.
The first is familiar. The second is largely unprecedented.
And together, they could create a much more significant shakeout than we’ve seen in previous cycles.
The irony is that some miners may be abandoning Bitcoin just as the industry is approaching the conditions that eventually restore profitability.
I don’t think Bitcoin mining is going anywhere.
The industry is restructuring.
$BTC
$ETH is approaching a critical moment in its market structure.
Looking at the logarithmic chart, ETH has spent nearly six years consolidating beneath a major resistance level while maintaining a long-term ascending support trendline.
That structure is now being tested.
Here’s what I’m watching:
Bullish Scenario 🟢
ETH needs to reclaim the $2,000–$2,100 region and establish it as support. Doing so would put the ascending trendline back in play and open the door for another attempt at the $4,800–$5,000 resistance zone.
A confirmed breakout above that multiyear ceiling would represent a major structural shift, potentially opening the door to price discovery.
Bearish Scenario 🔴
Failure to reclaim $2,000, combined with a sustained breakdown below the $1,500–$1,600 support region, would significantly weaken the long-term structure.
That could expose ETH to a much deeper correction, with the $800–$900 region representing the next major historical demand zone.
The RSI is also worth watching. Momentum remains below the 50 midpoint, suggesting sellers still have the advantage. A recovery above 50 would provide additional confirmation of improving momentum.
What’s fascinating is that Ethereum has spent years compressing between rising support and horizontal resistance.
The structure is reaching a decision point, and the next confirmed move could determine ETH’s trajectory for years to come.
I lean heavily bullish.👉🏽👀🐂
$ETH
🚨 $ETH: THE NEXT MAJOR MOVE COULD CATCH EVERYONE OFF GUARD. 👀
Ethereum is sitting at a critical macro inflection point, and the technicals are telling an interesting story. 🔥
Here’s what stands out. 👇
🟢 Bull Market Support Band: ETH is fighting to reclaim this crucial zone near $2,100. Historically, sustained moves above it have accompanied powerful bullish trends.
📊 MACD: Momentum is stabilizing near the zero line. A bullish crossover could be the first indication of a larger trend reversal.
⚡ Stochastic RSI: Rolling into oversold territory, suggesting another short-term flush could set up the next bullish rotation.
💰 Volume Profile: Heavy trading activity around $2,000–$2,200 makes this a major battleground. Lose this region, and $1,610 becomes the next critical support.
📈 Macro Structure: Despite years of volatility, ETH is still testing its multiyear ascending trendline. The larger bullish structure hasn’t been decisively invalidated.
🎯 MY OUTLOOK🔎
I wouldn’t rule out one final shakeout before the next major expansion.
If ETH holds macro support and reclaims the bull market support band, $4,000–$4,800 becomes the next major target.
Break that resistance, and $6,000–$8,000 enters the conversation. 🚀
The best opportunities often develop when sentiment is weakest, but price confirmation is everything.
Are we witnessing the final stages of accumulation? 👀
#ETH
$TSLA is setting up for what could be one of its most significant breakouts in years.
Take a look at the higher-timeframe structure.
Since its 2021 peak, Tesla has spent nearly five years building what appears to be a massive C&H formation, with price repeatedly testing the $380–$400 resistance region.
A few things stand out:
👉🏽The Cup: A multiyear rounded recovery from the 2022–2023 lows, suggesting a prolonged period of consolidation and accumulation.
👉🏽The Handle: Price has recently been compressing into a tightening structure just beneath major resistance, with higher lows and increasingly narrow price swings.
👉🏽The Breakout: A decisive move above the $380–$400 region, ideally accompanied by expanding volume, would strengthen the bullish case and potentially confirm the pattern.
👉🏽The Measured Move: The chart projects approximately 386% upside from the breakout region, implying a long-term technical target near $1,850.
What’s particularly interesting is the amount of time Tesla has spent developing this structure. Multiyear consolidations can produce powerful directional moves once major resistance is cleared.
However, the setup remains unconfirmed. Another rejection at resistance could extend the consolidation or invalidate the developing handle.
The longer the base, the bigger the potential move.
The chart has spent years building this structure. Now the question is whether buyers have enough conviction to finally break through.
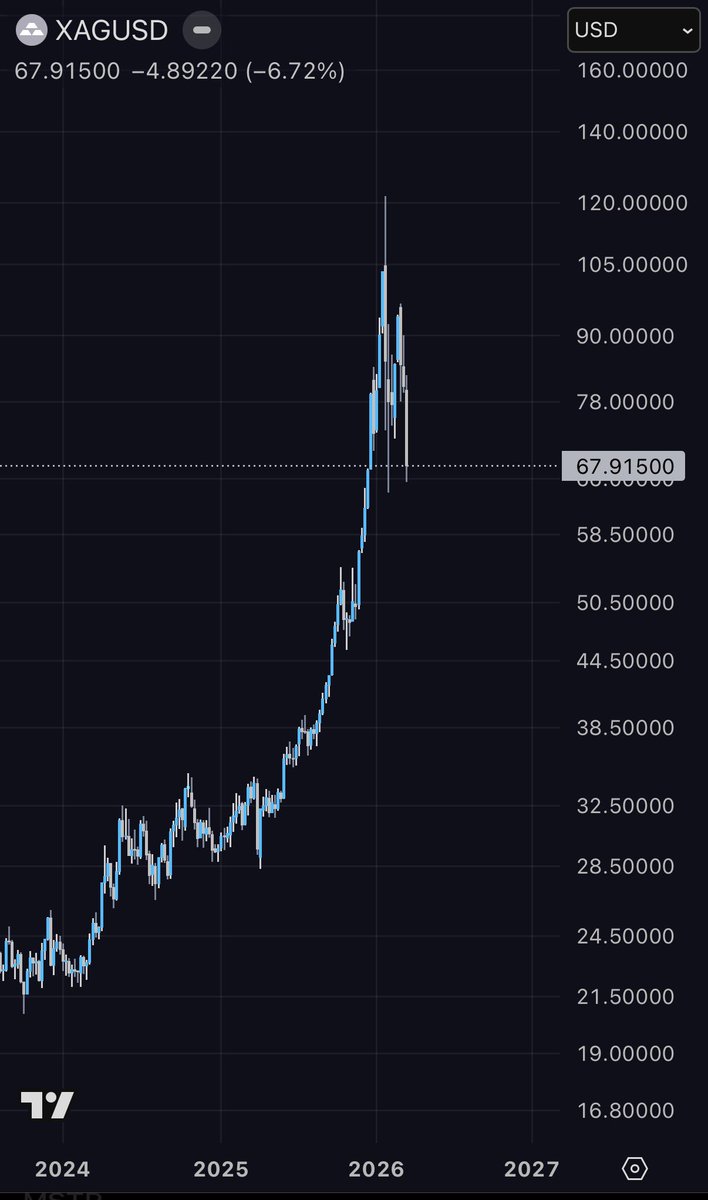
$XAG silver ENDED IN A FLAMING BALL OF MISERY.
Where the $250 top callers go?
Lesson in parabolas for you.
When the rest of the market was top blasting, I was telling you to sell.
Likely headed to 50-35.
Congrats - you bought the top of crypto and metals. How does it feel?