Goldman Sachs just raised its price target on Nvidia $NVDA to $605 from $495 while maintaining its Buy rating
JPMorgan raised its price target on Nvidia $NVDA to $600 from $500 while maintaining its Overweight rating
Bank of America raised its price target on Nvidia $NVDA to $650 from $550 while maintaining its Buy rating
Morgan Stanley raised its price target on Nvidia $NVDA to $630 from $500 while maintaining its Overweight rating
Citi raised its price target on Nvidia $NVDA to $630 from $520 while maintaining its Buy rating
Wells Fargo raised its price target on Nvidia $NVDA to $600 from $500 while maintaining its Overweight rating
Rosenblatt raised its price target on Nvidia $NVDA to $1,100 from $800 while maintaining its Buy rating
Barclays raised its price target on Nvidia $NVDA to $650 from $600 while maintaining its Overweight rating
Piper Sandler raised its price target on Nvidia $NVDA to $620 from $500 while maintaining its Overweight rating
Jefferies raised its price target on Nvidia $NVDA to $610 from $500 while maintaining its Buy rating
Mizuho raised its price target on Nvidia $NVDA to $590 from $530 while maintaining its Buy rating
Evercore raised its price target on Nvidia $NVDA to $600 from $550 while maintaining its Outperform rating
TD Cowen raised its price target on Nvidia $NVDA to $600 from $500 while maintaining its Outperform rating
Bernstein raised its price target on Nvidia $NVDA to $675 from $475 while maintaining its Outperform rating
Wolfe raised its price target on Nvidia $NVDA to $630 from $570 while maintaining its Outperform rating
HSBC raised its price target on Nvidia $NVDA to $800 from $780 while maintaining its Buy rating
Baird raised its price target on Nvidia $NVDA to $750 from $570 while maintaining its Outperform rating
Keybanc raised its price target on Nvidia $NVDA to $670 from $620 while maintaining its Overweight rating
Oppenheimer raised its price target on Nvidia $NVDA to $650 from $500 while maintaining its Outperform rating
Raymond James raised its price target on Nvidia $NVDA to $600 from $500 while maintaining its Strong Buy rating
Wedbush raised its price target on Nvidia $NVDA to $600 from $490 while maintaining its Outperform rating
UBS raised its price target on Nvidia $NVDA to $560 from $540 while maintaining its Buy rating
Deutsche Bank raised its price target on Nvidia $NVDA to $560 from $440 while maintaining its Buy rating
BMO raised its price target on Nvidia $NVDA to $600 from $550 while maintaining its Outperform rating
BNP Paribas upgraded Nvidia $NVDA to Outperform from Neutral while raising its price target to $745 from $440
Stifel upgraded Nvidia $NVDA to Buy from Hold while raising its price target to $600 from $440
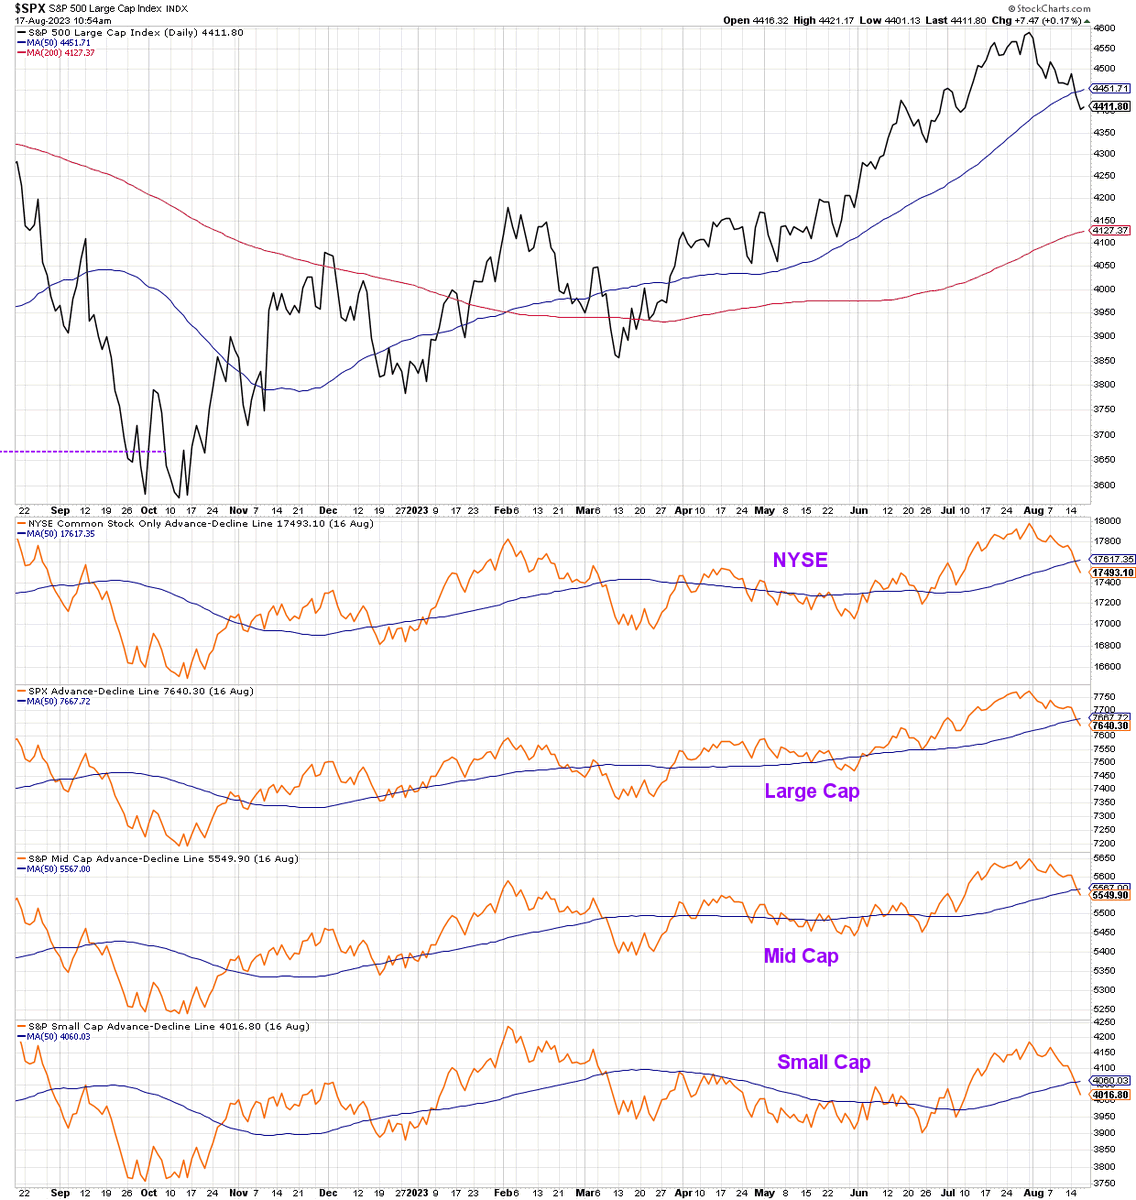
Advance-decline lines for the $NYA, $SPX, $MID and $SML all breaking below their 50-day moving averages this week, providing yet another example of a market in distribution phase. Be bullish when these lines are going up, not down!
Fed’s banking on CPI print of July to be released on August 10, 2023 to be declining sharply towards 2% just as the July CPI declined considerably to 3% earlier realised this month.
The problem is one higher CPI print between now and the September FOMC and this show is over.
If DJIA closes in green today, it will match the longest winning streak. The longest winning streak on record is 13 trading sessions, which ended on January 14, 1987.
Fed’s banking on CPI print of July to be released on August 10, 2023 to be declining sharply towards 2% just as the July CPI declined considerably to 3% earlier realised this month.
The problem is one higher CPI print between now and the September FOMC and this show is over.
VIX all across the globe continues to remain depressed which seems like has become the new normal. Any breakout and sustaining above 12-13 should give you some important clues about the next few weeks.
Indian Equity Money flow has been very synonymous and directly correlated with commodities such as gold/silver which has also been surging in last few weeks. Trend in commodities to be tracked for the same because this week we saw weakness in silver and to an extent in gold.
Bullish sentiment is at its highest level since April 2021; now unusually high. Bearish is at its lowest level since June 2021. Now at the bottom of its typical range…
USDINR VS DXY
Despite huge selling pressure in DXY, INR continues to trade at 82 over the months. With DXY pulling back this week, will the next month show depreciation in INR if dollar does continue to increase in value or is this just another pullback on DXY…
Weekly RS chart for $QQQ (tech etf) vs $DIA (industrial average etf). Resistance coming in from 1.10 which was the high at the time of 2000 tech bubble. Tech has never been stronger than the industrial group by more than 1.1 times since the 2000 dot com bubble.
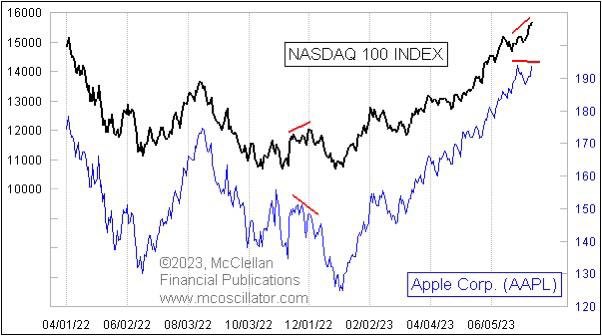
Apple vs Nasdaq
Nasdaq and $AAPL almost always mimic each others’ movements and directions until this week and a few instances over the last few years. What does these divergences entail, time will be the best judge.
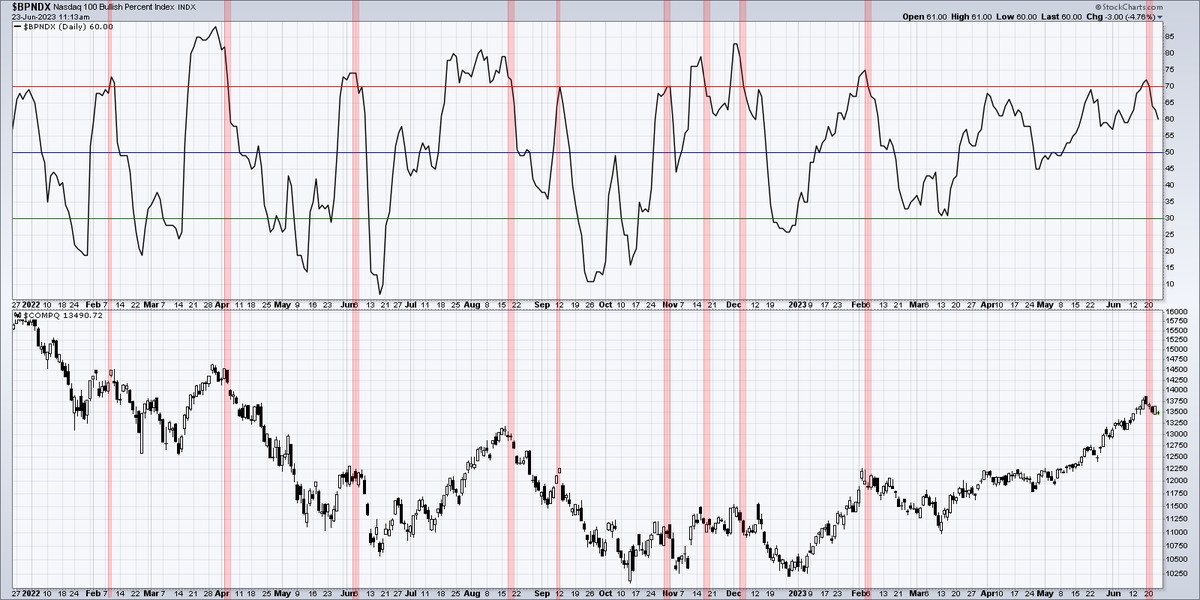
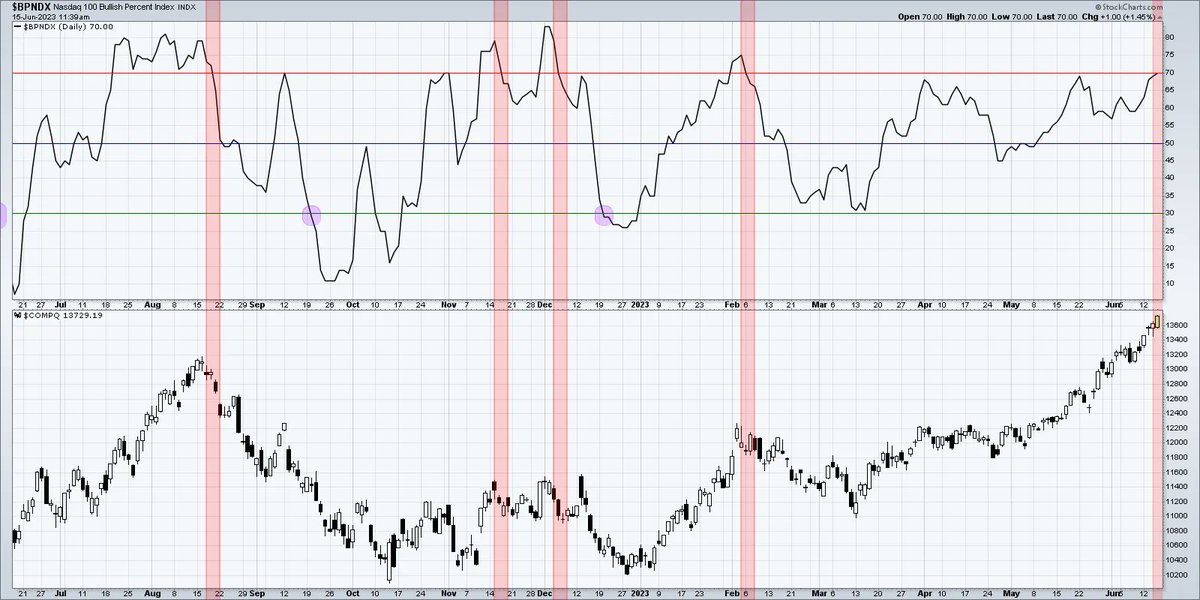
$NDX Bullish Percent Index just gave a sell signal this week, suggesting pullback mode for large cap growth. Downside objective for $NDX?..
https://t.co/zzLMQ8syvj
Nasdaq 100 Bullish Percent Index $BPNDX is now at the 70% level. History tells us that when this indicator goes above 70% and then breaks back below, there's your downside correction. Maybe the most important chart to watch to gauge a potential pullback within a raging bull! $QQQ
AAII Sentiment Survey:
*Bullish: Highest since 11/21/21 (48.0%), first time above average on consecutive weeks since November 2021
*Bearish - Lowest since 7/21/21 (22.2%)
https://t.co/CPRW7Qb6JE
Last month WTI crude was down over 11% which has massively contributed to lower inflation at 4% (2 year low). Core CPI (which ignores food and fuel) is still north of 5% since 2022.