Want to know how to avoid major drawdowns and improve your returns in the stock market?
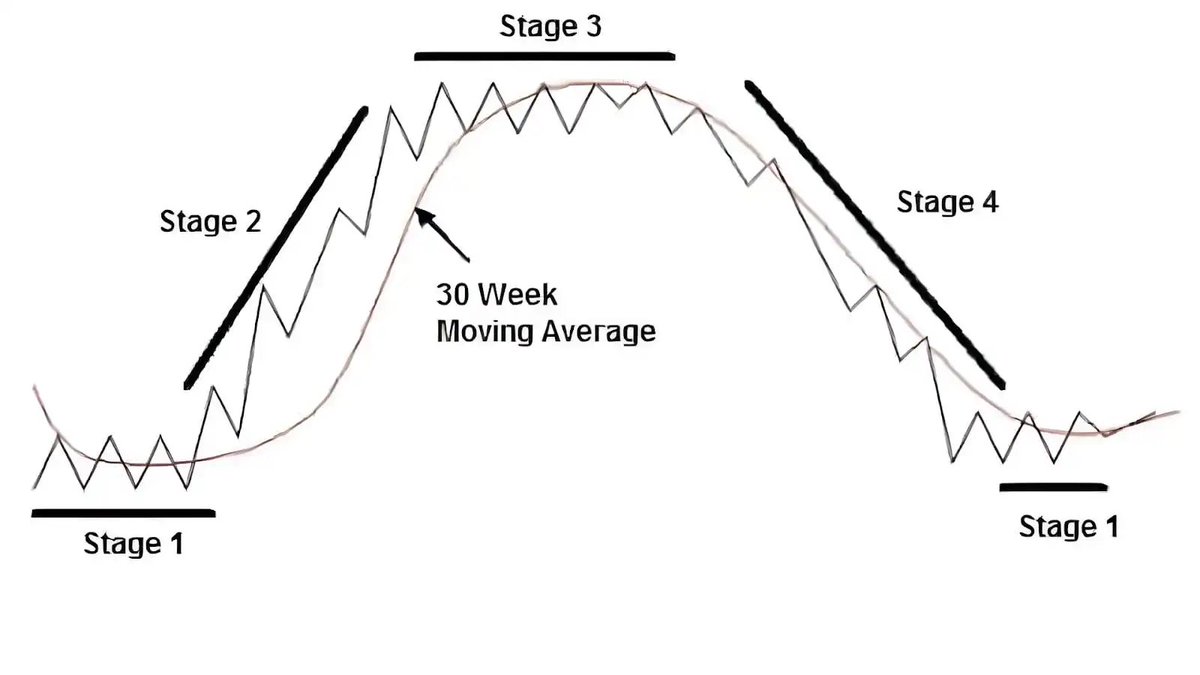
Understanding Stan Weinstein's Stage Analysis is a great place to start. Every stock moves through 4 stages!
One of the most important lessons I've learned from Stan Weinstein's Stage Analysis is understanding where a stock stands in its market cycle and when to buy, hold, reduce exposure, or stay away.
The framework primarily uses the 30-week moving average (roughly equivalent to the 150-day SMA), price action, volume, and relative strength.
Stage 1: Basing / Accumulation
What does it look like?
- Usually forms after a prolonged Stage 4 downtrend
- Stock stops making consistent lower lows and starts trading sideways
- 30-week moving average begins to flatten
- Price moves above and below the flattening moving average
- Selling pressure decreases, and volume often dries up
What does it mean?
- The stock is trying to establish a bottom, but buyers haven't taken full control yet. This is where I start building my watchlist and looking for improving technicals, higher lows, and signs of accumulation.
- Remember, a stock falling 50-70% doesn't automatically make it a Stage 1 base. It needs time to stabilize and build a proper structure.
Stage 2: Advancing/Uptrend
What does it look like?
- Stock breaks out above its Stage 1 base
- Breakout ideally happens on expanding volume
- 30-week moving average starts sloping upward
- Higher highs and higher lows
- Relative strength improves against the broader market
What does it mean?
- Buyers are taking control, and institutional accumulation may be supporting the uptrend.
- This is my favorite stage to own growth stocks! I generally look for Stage 1 → Stage 2 breakouts and constructive pullbacks to rising moving averages.
- The goal isn't to buy at the absolute bottom but to participate when the stock starts showing evidence of a sustainable uptrend.
Stage 3 vs. Stage 4 - This is where a lot of us make mistakes!
Stage 3: Topping / Distribution
What does it look like?
- Usually forms after a prolonged Stage 2 advance
- Momentum slows, and price starts moving sideways
- 30-week moving average begins flattening
- Price repeatedly crosses above and below the moving average
- Breakouts start failing, and selling volume may increase
- Major support levels are still holding
What does it mean?
- The previous uptrend is losing momentum, and the stock may be going through distribution.
- Stage 3 doesn't automatically mean a crash is coming. Some stocks consolidate and resume their uptrends.
- For me, this is where I become cautious, tighten risk management, consider trimming positions, and avoid aggressively adding exposure.
Stage 4: Declining / Downtrend
What does it look like?
- Stock breaks below major support or its Stage 3 range
- 30-week moving average starts sloping downward
- Price trades below the declining moving average
- Lower highs and lower lows
- Short-term rallies often fail near declining moving averages
What does it mean?
- Sellers are in control, and the stock is in a downtrend.
- One of the biggest lessons I've learned is that technicals often reveal weakness before fundamentals do.
- A company can continue reporting strong earnings while its stock is entering Stage 4 because the market is already pricing in future expectations.
The biggest difference between Stage 3 and Stage 4:
Stage 3 = Sideways price action, flattening moving averages, potential distribution.
Stage 4 = Support breakdown, declining moving averages, established downtrend.
Another important thing to understand is that Stage 1 and Stage 3 can look very similar!
Both involve sideways price action and flattening moving averages. The difference is what happened before:
- Sideways consolidation after a prolonged decline could be Stage 1.
- Sideways consolidation after a major advance could be Stage 3.
My approach is simple:
Stage 1 - Build your watchlist and prepare.
Stage 2 - Look for opportunities to participate.
Stage 3 - Protect your gains and manage risk.
Stage 4 - Protect your capital and avoid weak downtrends.
Stage Analysis isn't perfect, but it's one of the most valuable frameworks I've learned in my investing and trading journey.
I use technicals to understand WHEN to participate and fundamentals to understand WHAT I'm buying.
Understanding these four stages can make a tremendous difference in how you navigate market cycles!
I will also be filing a countersuit on behalf of the Banger Boys for attempting to silence a movement designed to disrupt and reshape the predatory scammer industry (Forex). The Banger Boys are not only essential to the trading community, but they also position themselves as a force capable of curbing and outperforming scammers within the FXNG ecosystem. We will not allow anyone to silence the Banger Boys or what they stand for. They deliver justice to the common person and help fight against those masquerading as Forex mentors
$BTC
Bitcoin is telling a story: 'Bullish.'
While commodities and equities are trading in the red, the crypto market stands out as the only green sector, signaling that this is where the current opportunities lie. Position yourself accordingly.
BTC to 100k
When I've fought price cycles in the past, sticking to my opinion, it has caused me immense pain.
I won't do that with AI, no matter how bullish the narrative and numbers are.
Stage analysis below keeps you on the right side of the market.
$FICO
$Fico has been a laggard in six-month relative strength, but it is recently showing strength on heavy volume. As the great trader Linda Raschke says, any laggard stock showing signs of strength with outsized relative volume is a clear sign of institutional buying.
$AVGO
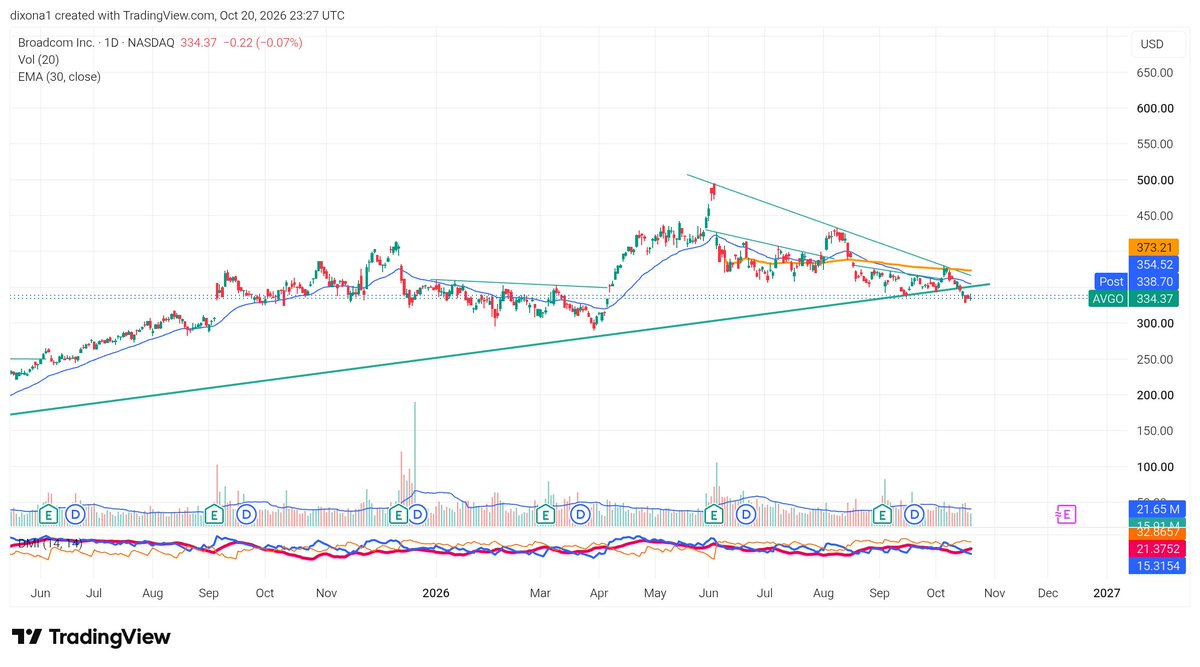
AVGO despite being a strong company, AVGO has been a laggard in 30-day relative strength. You cannot truly trust a blue-chip stock that fails to trend alongside its peers... I have been wrong three times on my long positions in it this year, haha. I believe it is now one of the stocks I am shorting
$ZCSH or $ZEC (spot) is the best chart in the market. If you missed it from the base breakout, it is presenting a perfect 10-week pullback buy. Super linear and orderly uptrend followed by super linear and orderly pullback. It has retraced 50% of the leg up on contracting volume.
Crypto, ZeCash/Hyperliquid in particular, remain my favorite opportunities looking forward 12 months.
When the opponent is swinging hard and landing shots on you, you don't start gunslinging. Pull back and defend: trading smaller, less frequent and more selective.
Wall Street won't teach you this. But market cycles will.
Linda Raschke scans for relative strength setups using cycle lows and start-of-quarter lookback periods. During market pullbacks, this isolates oversold laggards that are rotating back into leaders.
Scan cycles, not hype.
Trend systems blow up when the market changes character.
Linda Raschke separates directional trend regimes from mean-reversion environments. When clean breakouts turn into rotational, choppy tape, she shifts strategies before taking unnecessary drawdowns.
Adapt to the regime.