VIDEO: Liberal Tears Continue To Flow But Now They Are Calling For Violence Against Trump and His Supporters.
Watch The LIVE Stream Here:
https://t.co/B2W0a3YUQ4
While large stocks are partying like it's a new bull market, small stocks are getting crushed.
The Russell 2000, an index tracking small cap stocks, is down a massive 27% from its recent peak.
Meanwhile, the S&P 500 is officially up over 120% since its 2020 low.
Small companies are hurting while large companies are getting bigger.
Currently, the top 10% of stocks in the US now reflect ~75% of the entire market.
This is, by far, the most concentrated stock market since the Great Depression in 1931.
Truly historic.
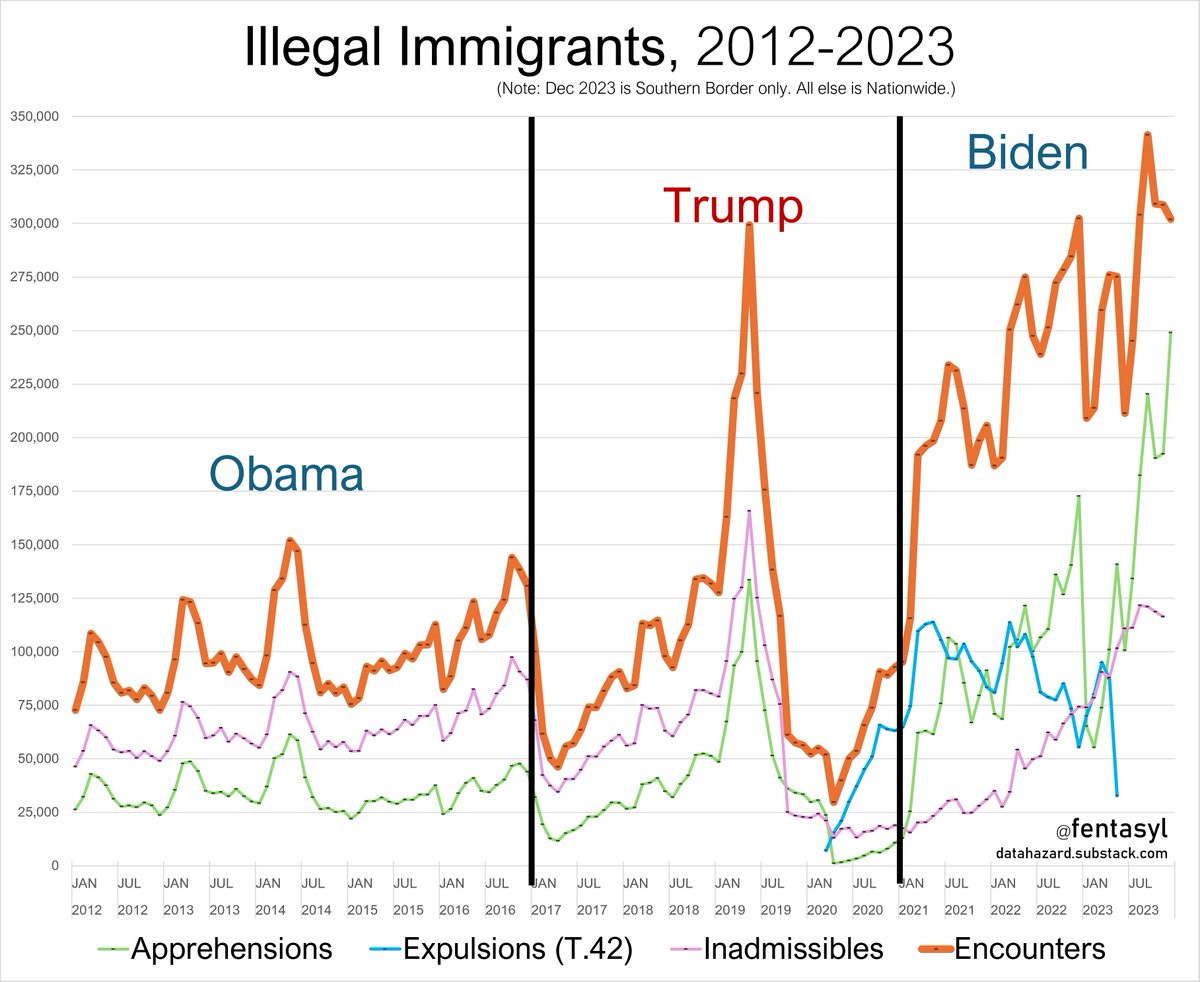
By all available metrics, this administration's border policy is a disaster. Monthly Encounters have averaged:
- 98,000 for the two previous administrations.
- 242,000 for the Biden border.
In fact, the flood of humans entering is so vast that Apprehensions alone now exceed the combined Encounters metric of the previous administrations.
Monthly Apprehensions have averaged:
- 34,000 for the previous two administrations.
- 111,000 for the Biden border.
And these averages understate the current situation -- it's getting worse every month.
December 2023 was the worst single month in history at the southern border.
He’s absolutely right, climate change is a scam.
I learned this in the work I did in renewable energies.
And it’s confirmed by where rich people and banks put their money.
They would never buy—or finance—beachfront property if global warming were true.
https://t.co/VrnvFYUxBf
U.S. Debt-to-GDP Ratio by Year:
- 1930: 17%
- 1940: 49%
- 1945: 114% (WW2 Ends)
- 1950: 86%
- 1960: 54%
- 1970: 35%
- 1980: 32%
- 1990: 56%
- 1995: 64%
- 2000: 54%
- 2005: 61%
- 2010: 92%
- 2015: 103%
- 2020: 127%
- 2022: 120%
We now have a higher Debt-to-GDP Ratio than post-WW2.
Total debt in the U.S. is up by $8.2 trillion since 2020, to $31.4 trillion.
By comparison, it took 230 years to add the first $8.2 trillion in debt from 1776 to 2006.
Buckle up.