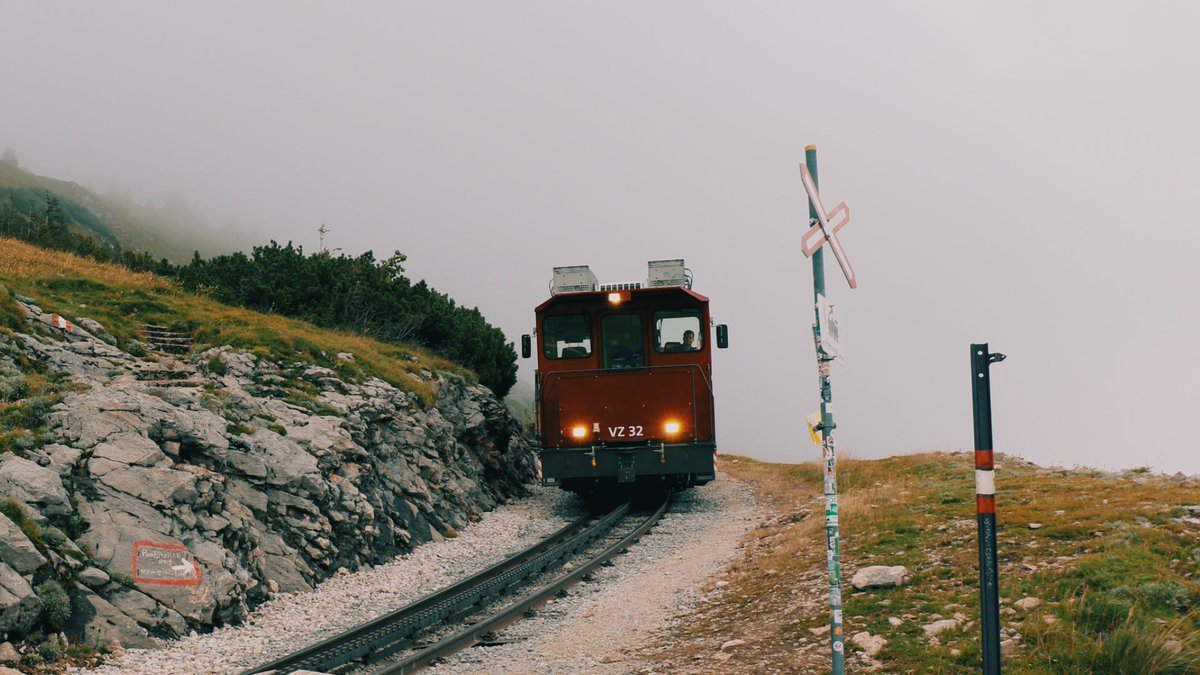
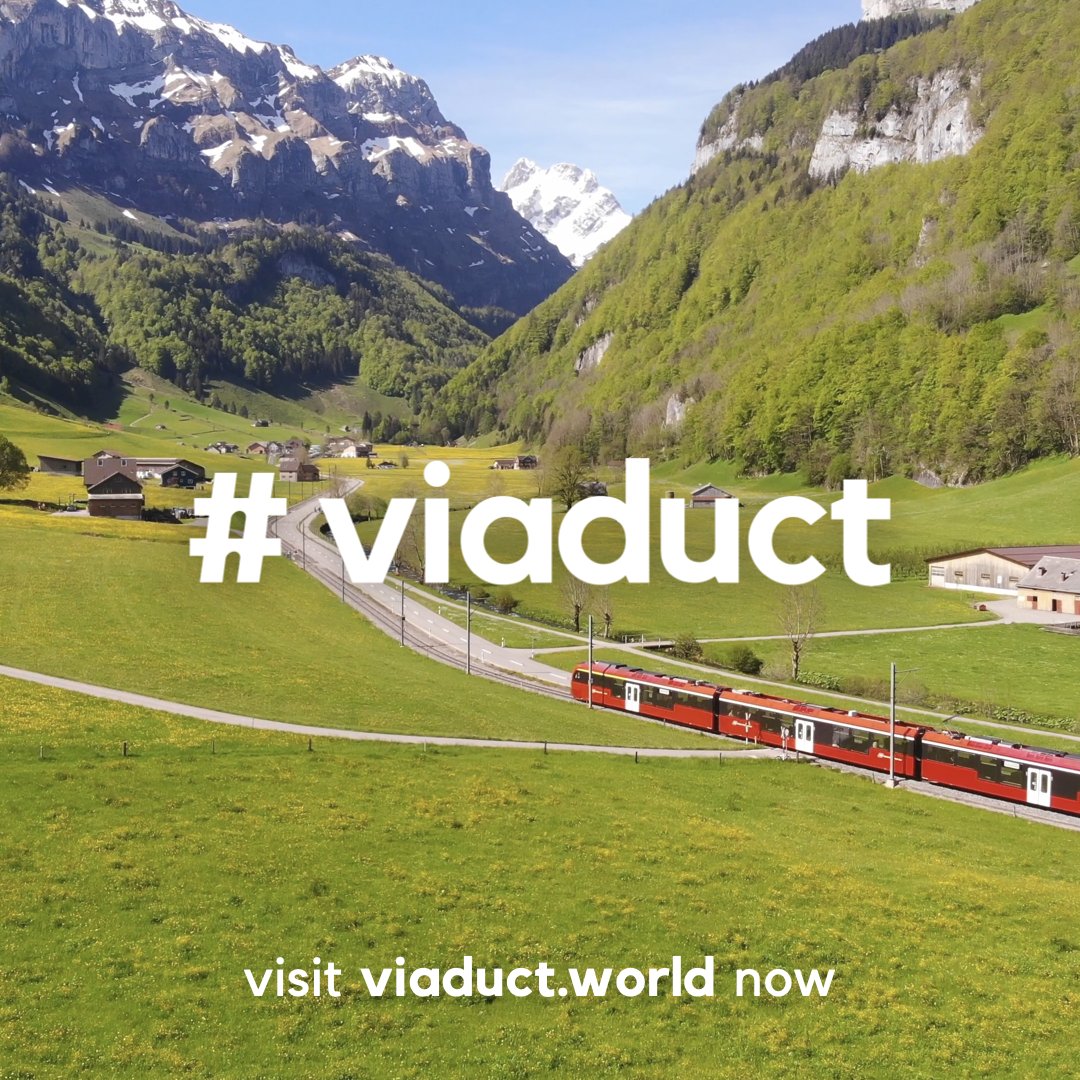
🚂Did you know you can log even the smaller cog railways with viaduct? Michael recently took the Schafbergbahn up to the Schafberg in Austria and, of course, recorded his journey in viaduct!
This scenic route is also part of our Austrian coverage map. 🇦🇹🌄
#viaduct#MyTrainMap #RailwayAdventure #AustriaByTrain #Schafbergbahn
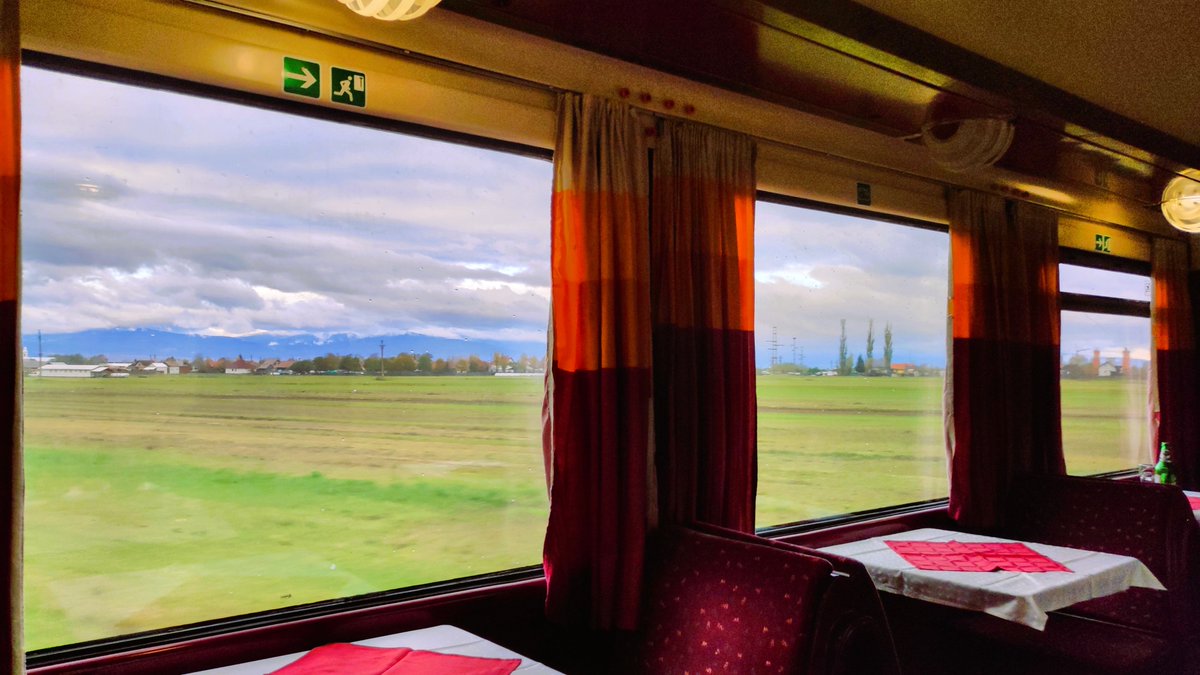
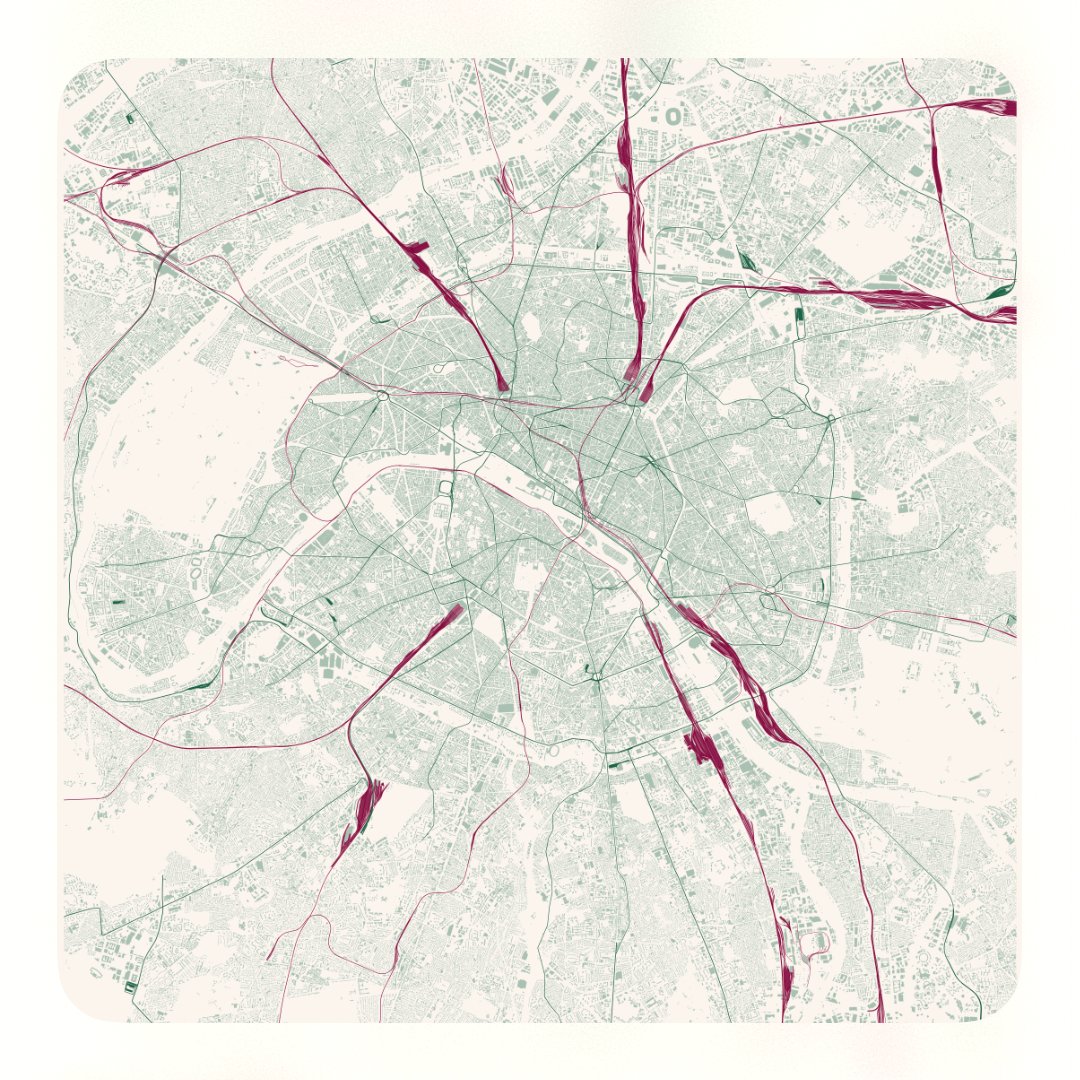
🖼️✨ Our journey is now a stunning #MyTrainMap poster in the "Map-in-Map" layout, complete with an overview map and some stats of our journey.
We traveled 2342 km, spent 44.4 hours on trains, rode 2 sleeper trains (Dacia and Corona - all-time favorites), and took 7 trips with the iconic Malaxa Class 77. Plus, we had a fabulous dinner on the IC Corona from Budapest to Brașov, making it a true #sleeperandeater train. 🚄💫
Turn your adventures into art with viaduct! #viaduct #TravelStats #RailwayPoster #TrainTravel #MapArt 🚉
🚄 Curious about the value of your season tickets? With viaduct, you can easily document and analyze the profitability of your season passes like KlimaTicket, BahnCard 100, and more! 🌍
1⃣Create a Season Pass🎫: Add your pass (Interrail, BahnCard 100, etc.) and the price you paid for it.
2⃣Add Your Trips: Log your journeys with viaduct
3⃣Assign Passes🎫, Savings💸 (amount you saved by using the season pass) and Costs💰(additional costs like reservations, upgrades, ...) to your trips
4⃣Track Profitability: Use the dashboard to see if your pass is worth it.
You can explore your trips on the interactive map🗺️ anytime.
Why not order a #MyTrainMap featuring last year's #Interrail journeys?🖼️
🚉 Start tracking your rail adventures today! #TravelSmart #RailJourneys #MyTrainMap
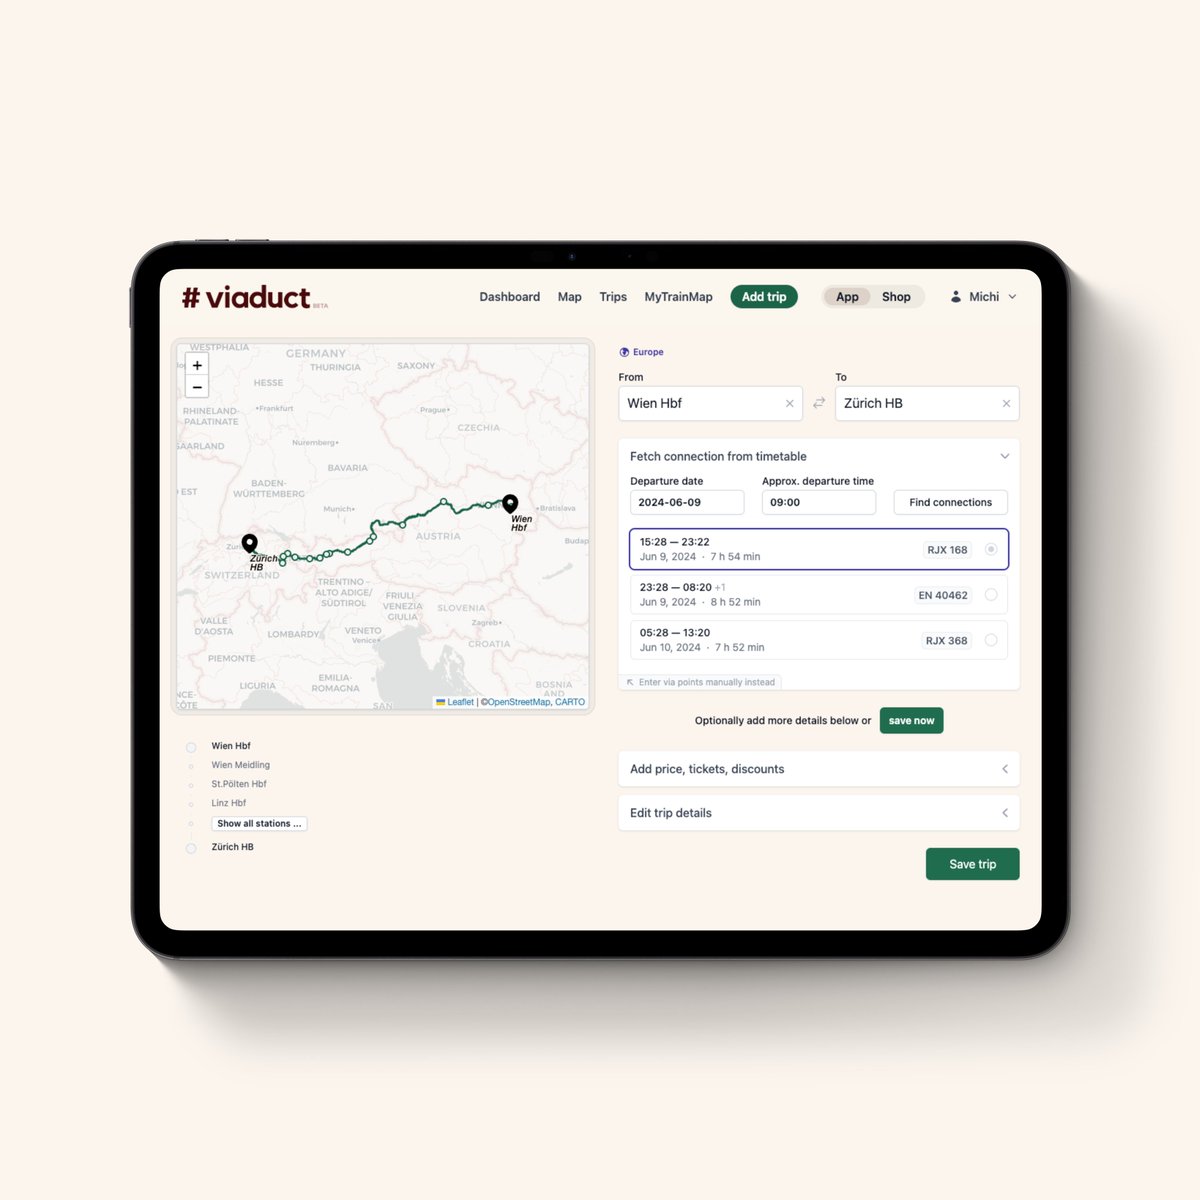
🚄🌍Train Routing with viaduct! 🚉✨
🔹Timetable-based: current timetables are used for detailed routes with stops, times, and train types. Only direct connections for now!
🔹Simple: Manually add and modify via-stations.
#MyTrainMap🗺️🚉
#Bahnzeit für unser neues Projekt: viaduct! 🎉🚄🚃🎉
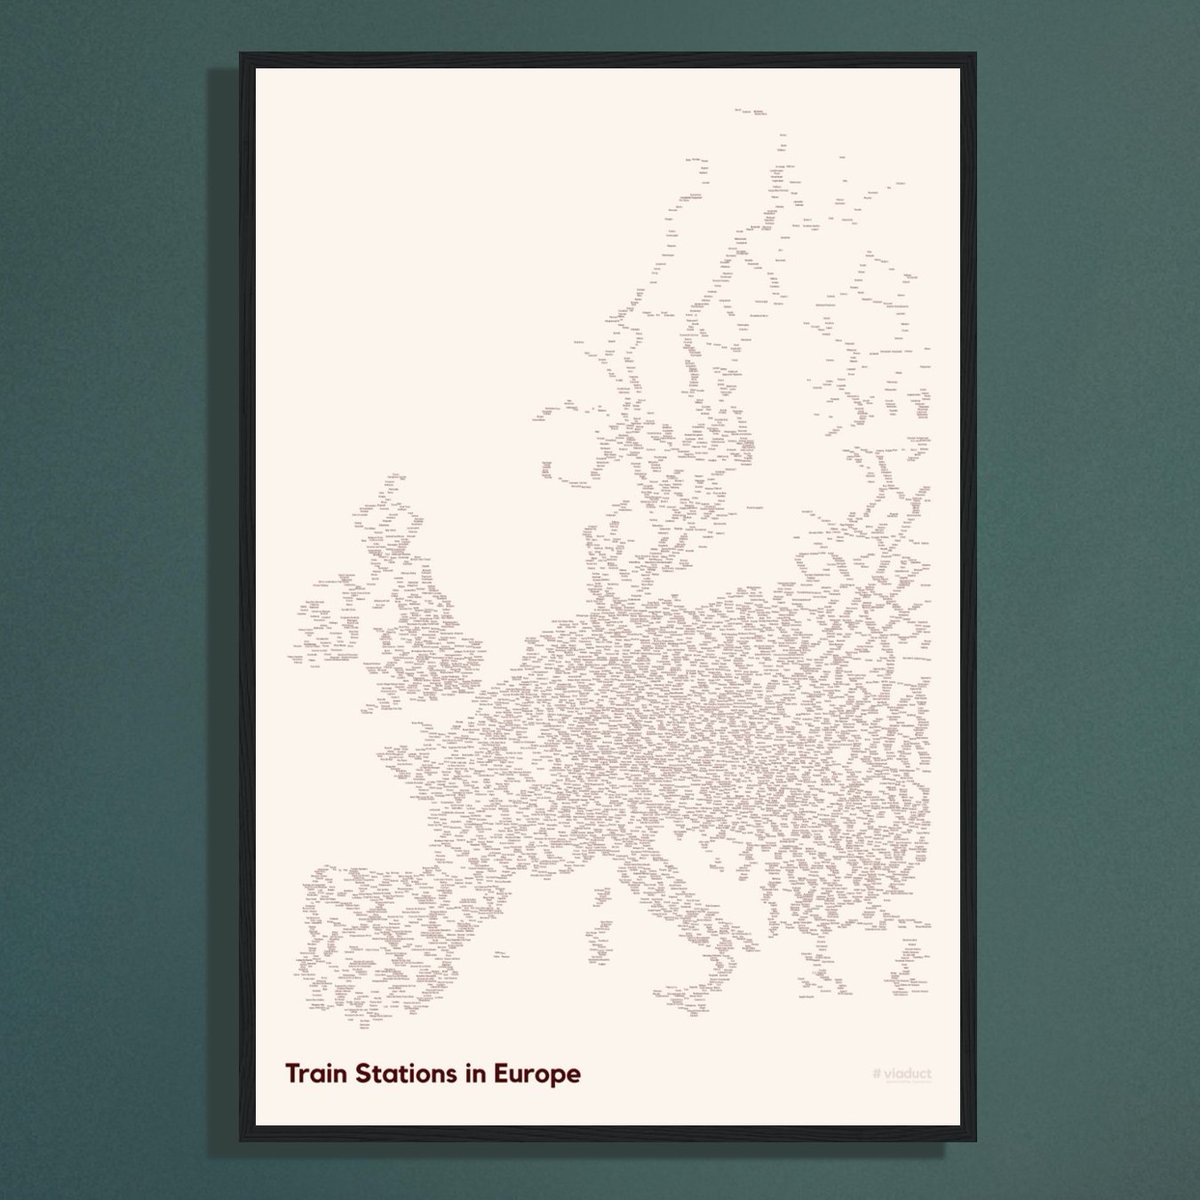
Tracke deine Bahnreisen, teile deine Zugreisestatistik und hol dir im Shop deine personalisierte #MyTrainMap oder entdecke unsere viaduct Poster!
Folge @viaduct_world um keine Updates zu verpassen!
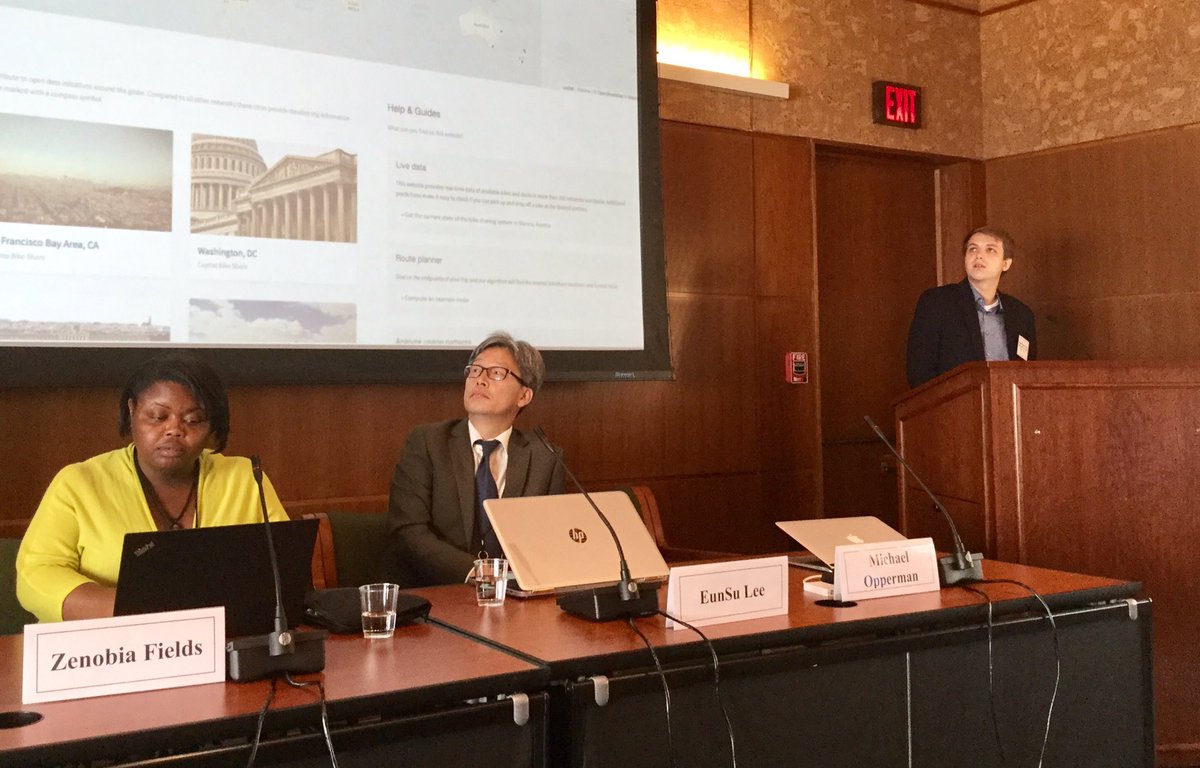
@oppermann_m#ieeevis short paper TimeElide from @oppermann_m & Luce Liu & me, in a nutshell
live demo! https://t.co/ipF7x2AwMT
25 sec video preview:
https://t.co/2ycUpcU9PF
open-source sw interface: pic 1
design space for non-contiguous time series slices: pic 2
Now
VizSnippets: Compressing Visualization Bundles Into Representative Previews for Browsing Visualization Collections
from @oppermann_m and me!
Delighted that we were awarded #ieeevis best paper honorable mention for this work
https://t.co/AfxJVLjBHq
https://t.co/yaoOVkPeIf
In Hungarian, we don’t use he/she there is only one gender pronoun “Ö”. But it’s fascinating when this is fed through Google Translate, the algorithms highlight the biases that are there. Then imagine enacting any kind of change from those biases, encoded into computer code.
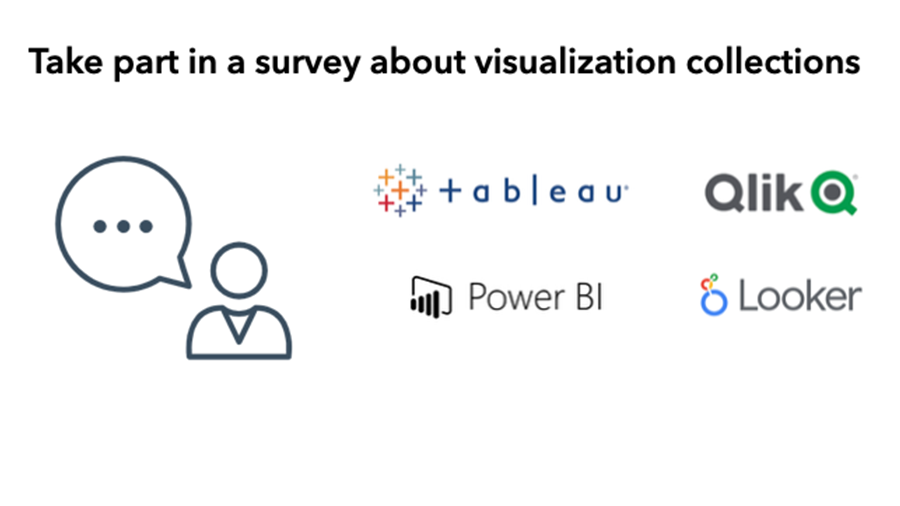
Do you use Tableau Online/Server/Public, Microsoft Power BI workspaces, QlikView/QlikSense, or Looker spaces? We're collaborating with Tableau to get your feedback! Plus, you'll get a chance to win an Amazon gift card.
https://t.co/2OJs1Y3Xp8
Password: viz
VizCommender: Computing Text-Based Similarity in Visualization Repositories for Content-Based Recommendations. By @oppermann_m, Kincaid, @tamaramunzner. In collaboration with @Tableau. https://t.co/lUeh2NfJ4F #ieeevis