A candle shows you 4 prices. A footprint chart shows every one: the volume traded at each price inside the candle, split into sellers and buyers.
Delta: buyers minus sellers, bar by bar.
Absorption: heavy selling hits one level and price doesn't break.
Read footprints, delta and absorption on https://t.co/uw71xcwTAy.
Not SEBI registered. For education and analysis only. Not investment advice. Footprint data is illustrative.
#orderflow #footprintchart #optionstrading #nifty50 #optionalgo
Options traders, meet your new Greeks dashboard. 📊
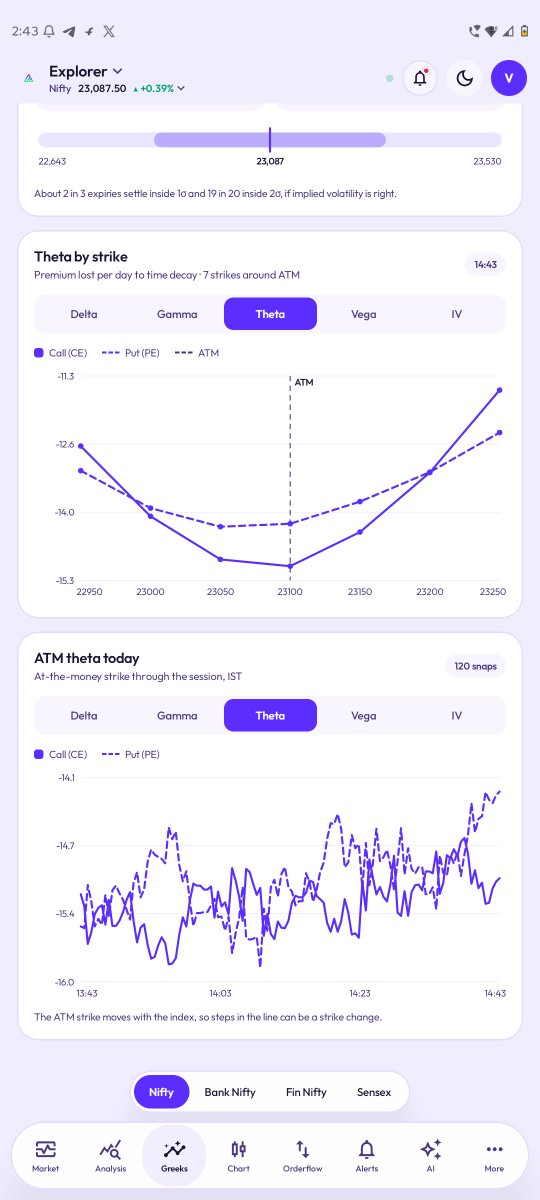
We’ve introduced the Greeks section in our app to help you explore how option sensitivity changes across strikes and through the session.
Swipe through to see:
• Delta — premium sensitivity to an index move
• Gamma — how quickly Delta can change
• Theta — the effect of time decay
• Vega — sensitivity to changes in implied volatility
• IV — implied volatility across strikes
Compare Call and Put values around the ATM strike, then follow the ATM trend through the session. Nifty, Bank Nifty, Fin Nifty and Sensex are available in the index selector.
Explore the new Greeks view in the app and use it as one part of your options research.
Disclaimer: For educational and informational purposes only. This is not investment advice or a recommendation to buy or sell any security or derivative. Options involve substantial risk; Greeks and implied volatility are estimates and may change with market conditions. Please do your own research and consult a qualified financial adviser if needed.
#OptionsTrading #OptionGreeks #NiftyOptions #TradingTools #OptionalGo
Still flipping through 500 charts every weekend? Stack a few filters (ROE, sales growth, debt to equity, 52-week high, breakouts) and 500+ stocks become a short list in seconds. Then open the full analysis page for each one.
Screen Lab is a free live tool at https://t.co/pbcx7mdHUy.
Disclaimer: Not SEBI registered. For education and analysis only. Not investment advice. Stocks and figures are illustrative.
#stockscreener #stockmarketindia #fundamentalanalysis #nse #optionalgo
Discover Flow AI by OptionAlgo — your AI-powered market analysis assistant for Indian F&O traders.
From live market flow and institutional activity to options structure, strike-wise positioning, GEX and volatility insights, Flow AI helps you understand what’s happening beneath the price chart.
Ask smarter questions. Analyse market activity. Make data-driven decisions.
Explore Flow AI on https://t.co/zcjvAdosOP and upgrade your market analysis workflow.
🔗 https://t.co/T7TCDrwher
Disclaimer: OptionAlgo is an educational analytics platform and is not SEBI registered. The information provided is for educational purposes only and does not constitute investment advice, trading recommendations, or a guarantee of returns. Trading in F&O involves substantial risk.
#OptionAlgo #FlowAI #NiftyOptions #FandOTrading #IndianStockMarket
Indian F&O traders — stop looking at price alone. Start analysing the data behind the move.
📊 GEX & Gamma Levels
🌊 Options Order Flow
📈 OI Change Map
🧠 Market Analytics & Trading Journal
Bring your market analysis tools together with https://t.co/zcjvAdosOP.
Explore the dashboard 👇
🔗 https://t.co/sMxY0oB7bI
Not SEBI registered. For educational and analytical purposes only. Not investment advice.
#NIFTY50 #OptionsTrading #FNO #BankNifty #Optionalgo
GEX tells you how dealers hedge when price moves.
Vanna tells you how they hedge when volatility moves. 📉📈
In this Reel:
🔹 What vanna is (Δ delta ÷ Δ IV)
🔹 Why OTM put deltas grow when IV rises
🔹 IV crush → dealers buy back hedges (the "vanna tailwind")
🔹 IV spike → dealers sell more, adding pressure into a fall
🔹 The catch: it assumes dealers are short the options, which isn't always true in India
Read vanna together with GEX + OI, never alone.
👉 Track GEX, OI & flow live at https://t.co/uw71xcwlL0
Educational content only. Not investment advice or a recommendation to buy or sell any security. Options trading carries substantial risk of loss; SEBI studies show 9 out of 10 individual F&O traders incur net losses. Do your own research or consult a SEBI-registered investment adviser.
#OptionsTrading #OptionGreeks #GammaExposure #Nifty50 #OptionAlgo
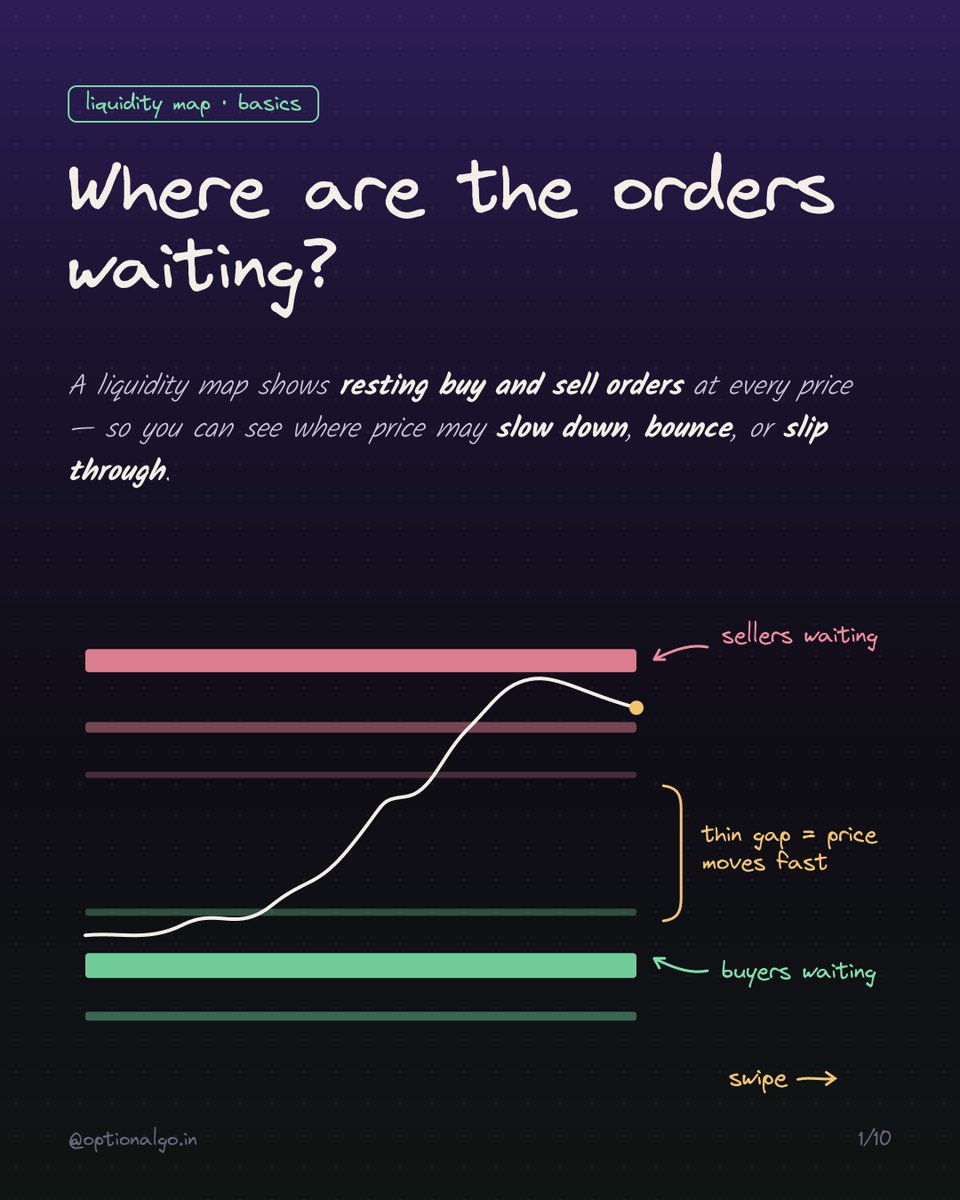
Where are the orders waiting? 👀
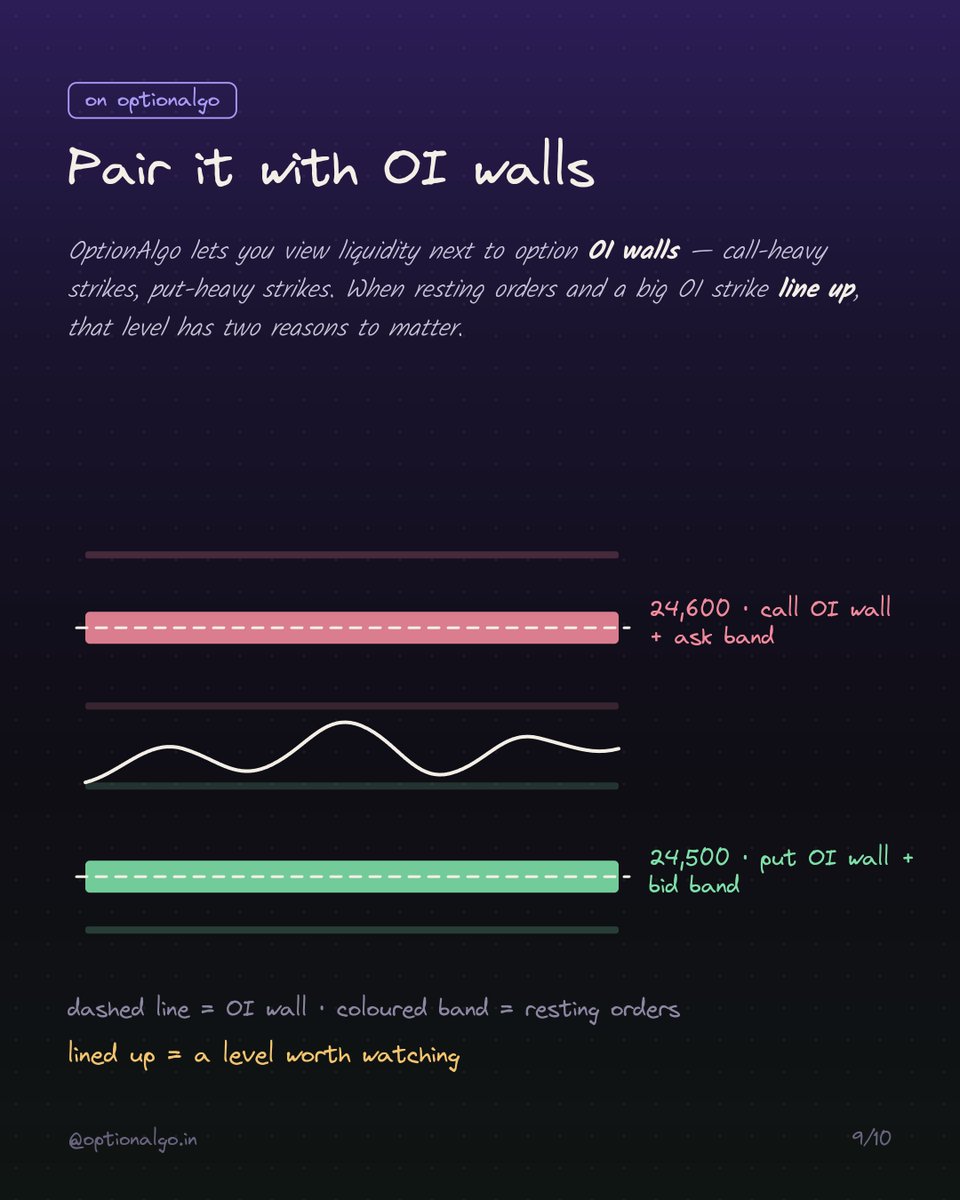
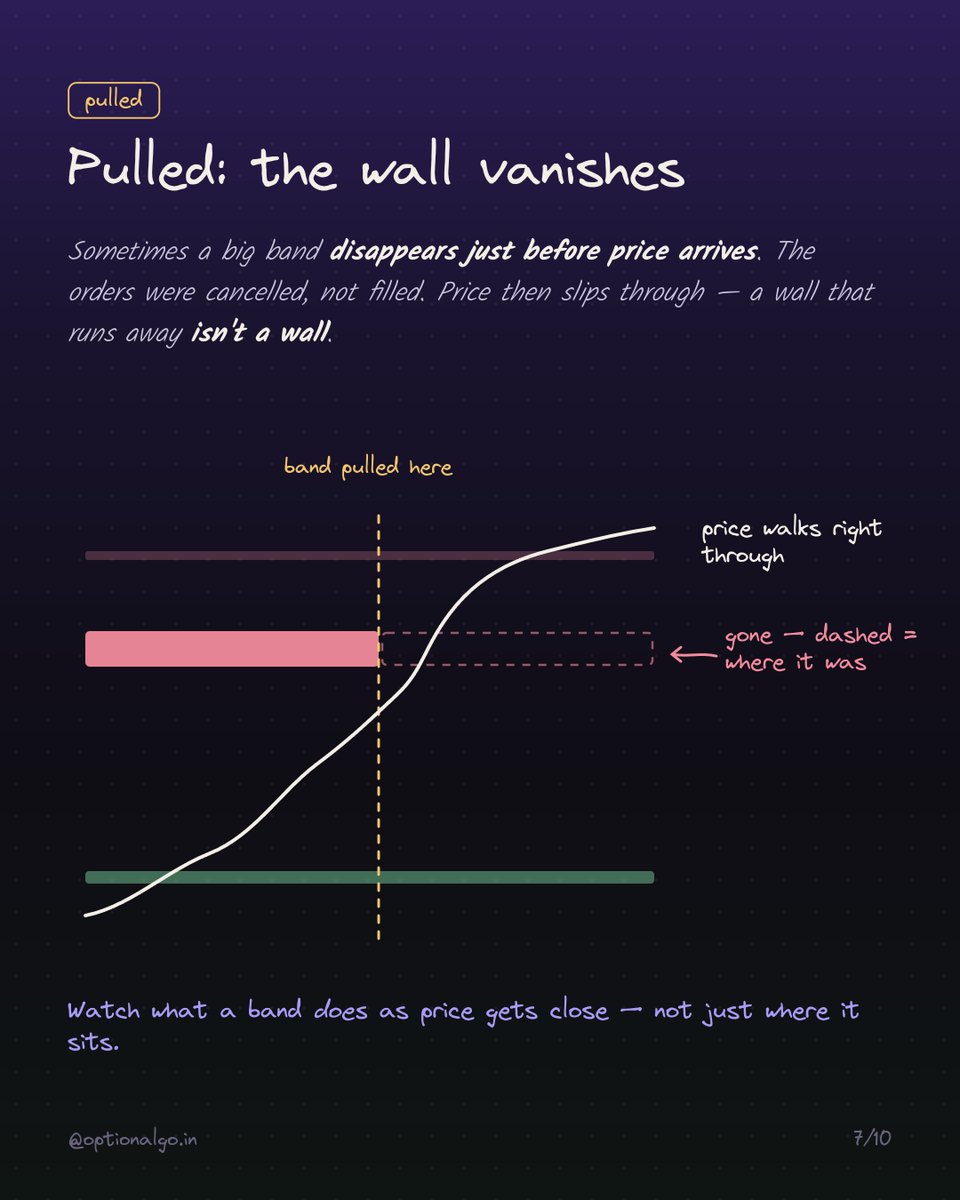
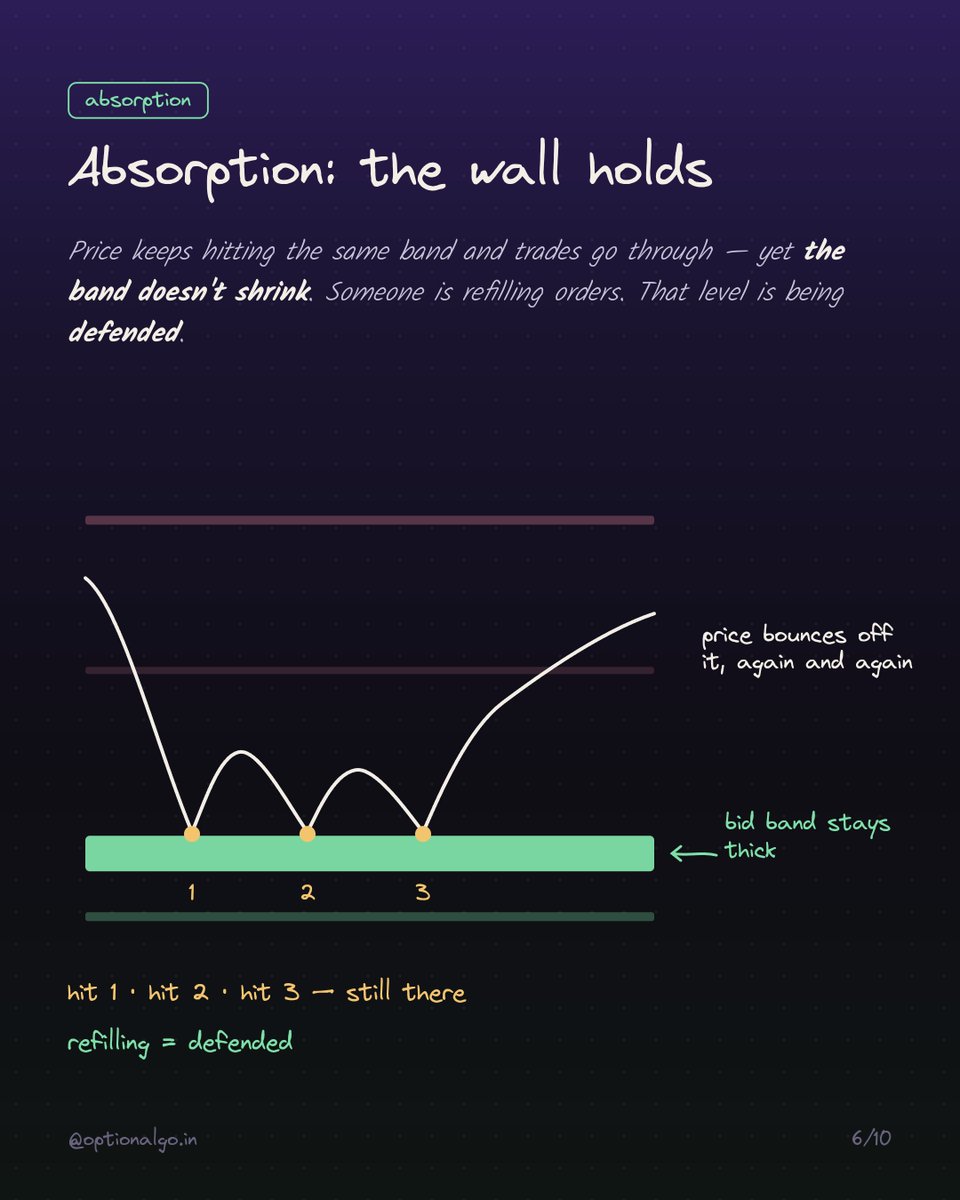
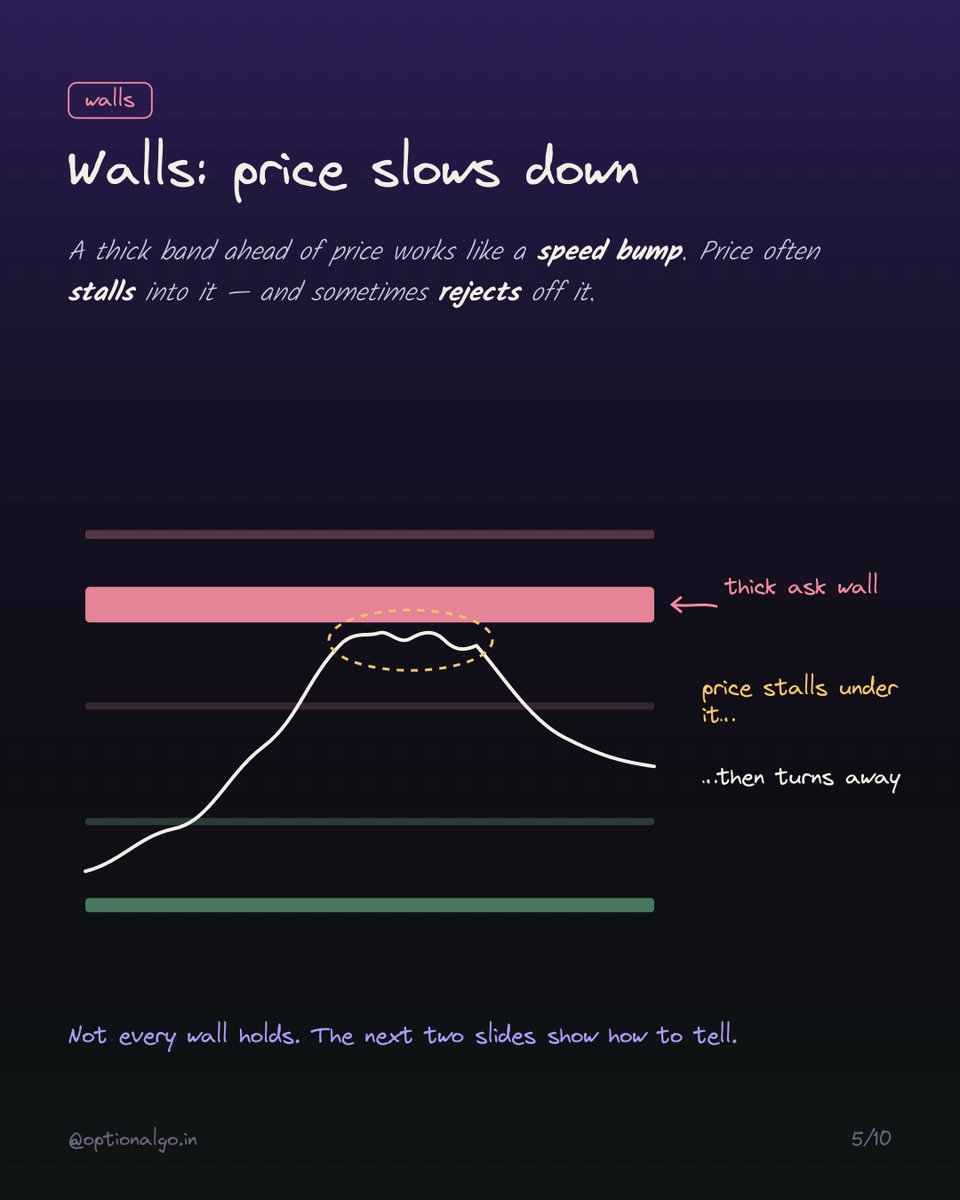
A liquidity map shows resting buy and sell orders at every price. Once you can read it, you can see where price may slow down, bounce, or slip right through.
Swipe through to learn:
🟥 Red bands = sellers waiting above
🟩 Green bands = buyers waiting below
🧱 Walls → price stalls
🛡️ Absorption → the wall holds
💨 Pulled liquidity → the wall vanishes
⚡ Thin zones → price moves fast
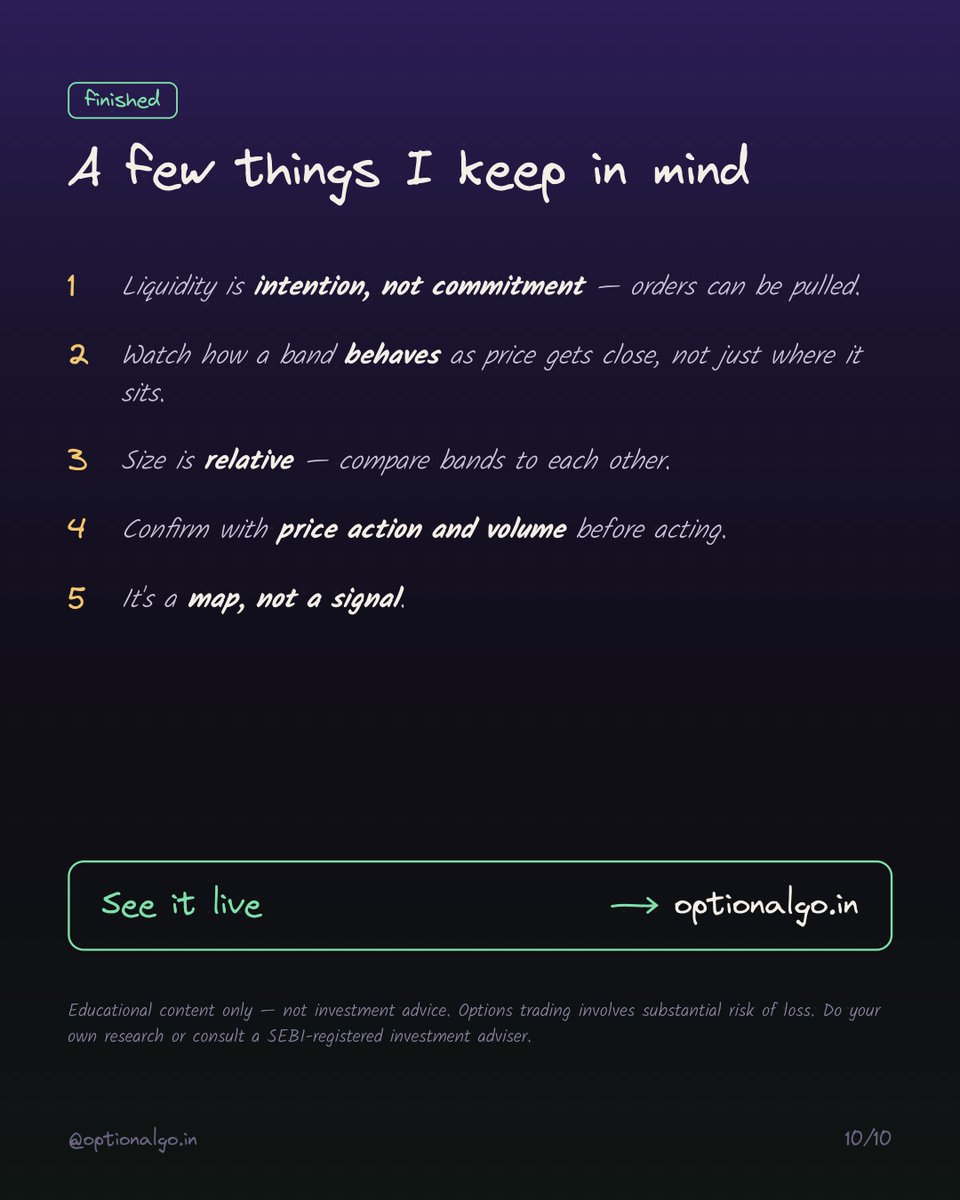
Liquidity is intention, not commitment. Watch how a band behaves as price gets close, not just where it sits.
Save this for your next session 📌
👉 See it live at https://t.co/uw71xcwTAy
Educational content only. Not investment advice or a recommendation to buy or sell any security. Options trading carries substantial risk of loss; SEBI studies show 9 out of 10 individual F&O traders incur net losses. Do your own research or consult a SEBI-registered investment adviser.
#OptionsTrading #OrderFlow #Nifty50 #StockMarketIndia #OptionAlgo
Pro-grade order flow & GEX, ₹67 a day
Pro-grade order flow and GEX for option traders, without the pro-grade price tag.
Free: live market tools
Analytics Pro: ₹999/month
Order Flow: ₹1,999/month, about ₹67 a day for the full order-flow desk
Compare plans at https://t.co/uw71xcwTAy.
Not SEBI registered. For education and analysis only. Not investment advice. Prices as of October 2026.
#optionstrading #fnotrading #tradingtools #stockmarketindia #optionalgo
5 tools every NIFTY option trader should use
Save this. 5 views that show what a plain price chart doesn't:
1. Market bias engine: flow, positioning and gamma in one score
2. GEX levels: gamma flip, call and put walls on the chart
3. Order flow: bid × ask volume at every price
4. OI change map: who's building and who's unwinding, strike by strike
5. Volume profile: POC, value area and VWAP
All five in one place at https://t.co/uw71xcwTAy.
Not SEBI registered. For education and analysis only. Not investment advice.
#NiftyOptions #Nifty50 #OptionsTrading #OptionsTrader #IndianStockMarket #StockMarketIndia #OptionChain #OpenInterest #OIAnalysis #OrderFlow #GammaExposure #GEX #VolumeProfile #VWAP #MarketAnalysis #TradingTools #TradingIndia #NiftyTrading #OptionTradingIndia #Optionalgo
See where the big money moves
Still trading NIFTY on gut feel? Big buyers and sellers leave a trail on the chart. OptionAlgo plots the large trades for you, along with footprint charts, GEX levels, volume profile, market profile and OI change by strike.
5 tools every NIFTY option trader should use
Save this. 5 views that show what a plain price chart doesn't:
1. Market bias engine: flow, positioning and gamma in one score
2. GEX levels: gamma flip, call and put walls on the chart
3. Order flow: bid × ask volume at every price
4. OI change map: who's building and who's unwinding, strike by strike
5. Volume profile: POC, value area and VWAP
All five in one place at https://t.co/uw71xcwTAy.
#orderflow #optionstrading #nifty50 #stockmarketindia #OptionsStrategy
Disclaimer: Not SEBI registered. For education and analysis only. Not investment advice.
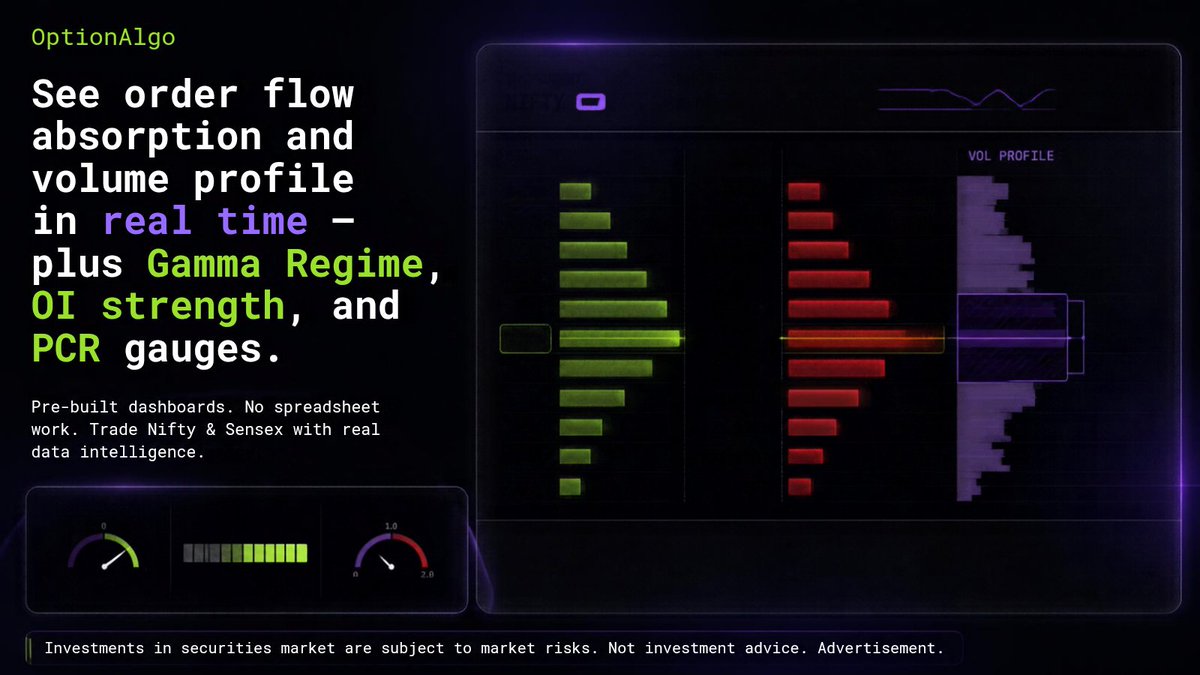
See order flow absorption and volume profile in real time — plus Gamma Regime, OI strength, and PCR gauges.
Pre-built dashboards. No spreadsheet work. Trade Nifty,Sensex, Banknifty,Finnifty Stocks and Commodities with real data intelligence.
https://t.co/rpMUveeiX2
Investments in securities market are subject to market risks. Not investment advice.
#OptionsTrading #Nifty50 #Sensex #OrderFlow #OptionChain #TradingIndia #StockMarketIndia #Optionalgo
Track options like a pro — live OI, PCR & gamma regime data, all in one dashboard.
👉 https://t.co/v5cdL6s8hB
Market data & analytics only. Not investment advice or trading signals. Trading in derivatives involves risk of loss.
Gamma Map × Option Volume Confluence
Where is the market building pressure?
The Gamma Map on OptionAlgo combines option-volume-based confluence levels with price action to help visualize where significant option activity is concentrated.
Instead of looking at price alone, you can observe:
• Gamma zones — areas of potential positioning concentration
• Option volume confluence — levels backed by notable options activity
• Call & Put zones — potential areas of market interest
• Price reaction around key zones — useful for contextual analysis
• Multi-level structure — see how option positioning aligns with the underlying
The goal isn't to predict the next move from a single indicator.
It’s about adding another layer of market context to your analysis.
📊 Gamma Map | Option Volume | Price Action | Confluence
Explore the Order Flow tools on OptionAlgo.
#OptionAlgo #GammaMap #GammaExposure #GEX #OptionVolume #OptionsTrading #Nifty50 #BankNifty #Sensex #IndianStockMarket #OptionsTradingIndia #OrderFlow #MarketStructure #PriceAction #TradingTools #TechnicalAnalysis #DerivativeTrading #NiftyOptions #StockMarketIndia