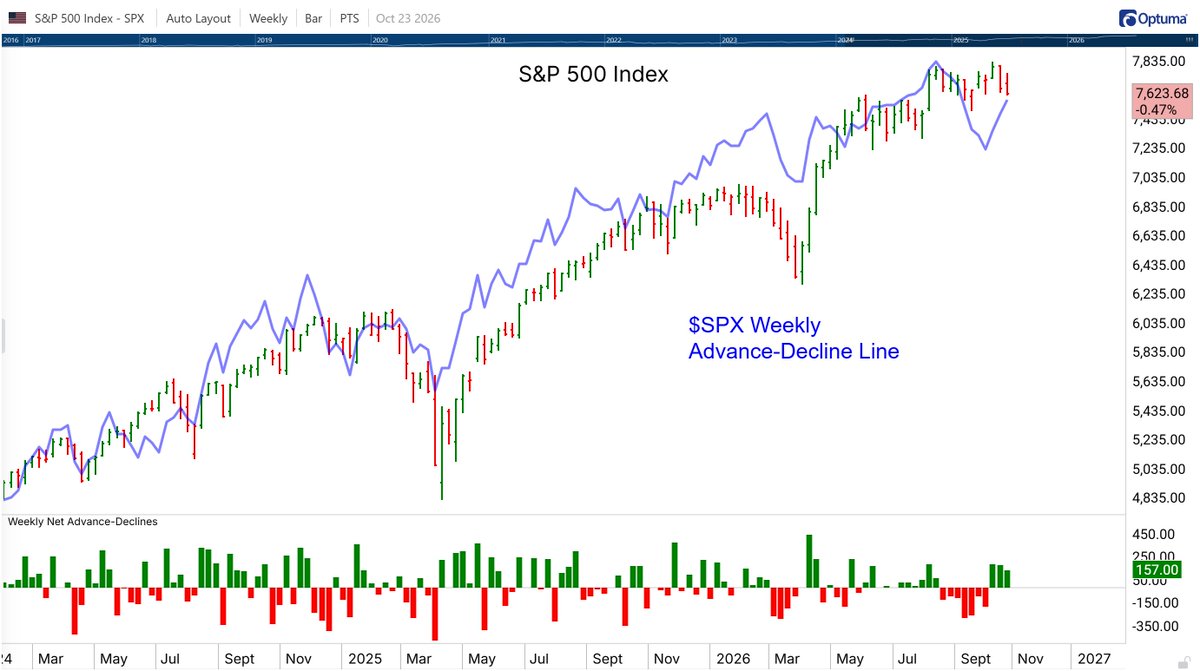
Weak daily breadth today for $SPX (net advance/decline of -231) but +157 on the week, despite a -0.5% loss. In fact, the index has closed lower the last 2 weeks with more stocks advancing.
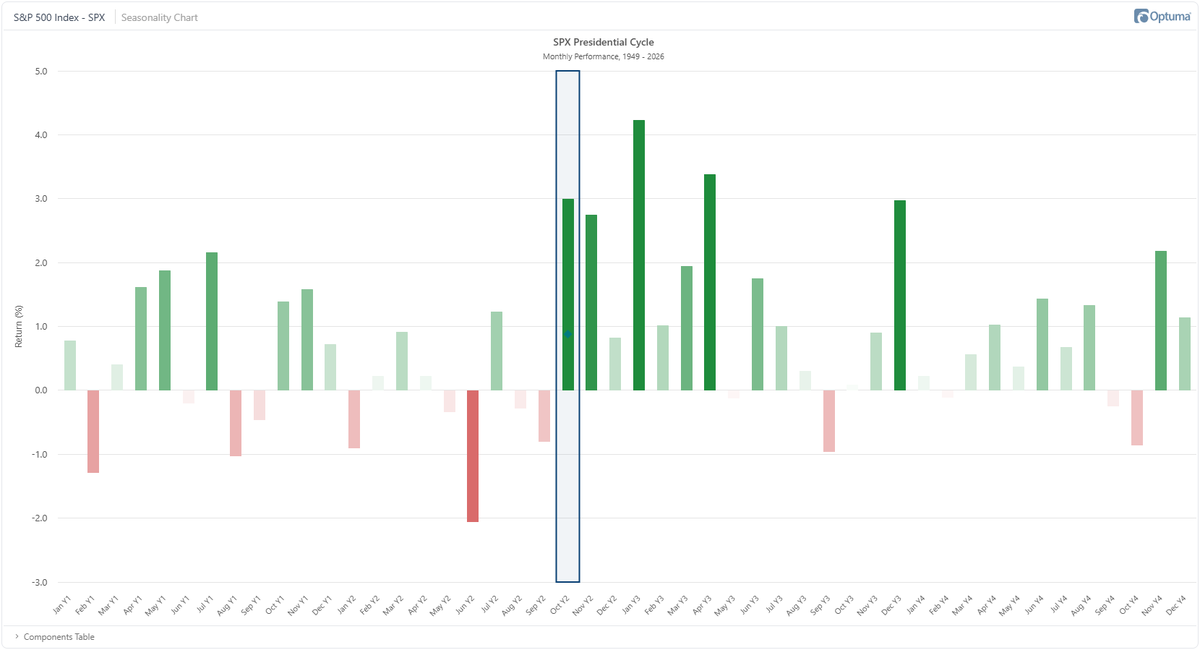
Here's the average monthly $SPX performance for the US Presidential cycle. The October of the midterm year is the 3rd best-performing month (3.0%) behind only January & April of Year 3:
Today ended a 53 day streak for the $SPX without a -1% fall - the longest since Jan 2020. Over that period the index gained 6.7% - mostly in the first few days of August.
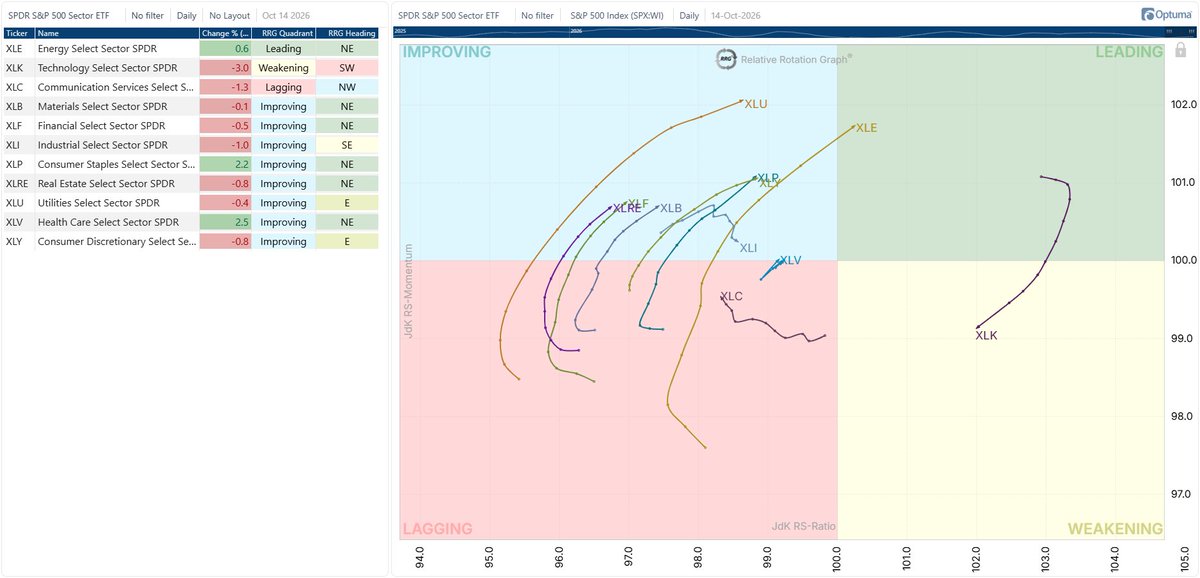
Energy $XLE is the only sector in the RRG Leading quadrant as tech $XLK weakens and heads southwest. 8 of the 9 other sectors are moving through Improving (only Communications $XLC is Lagging).
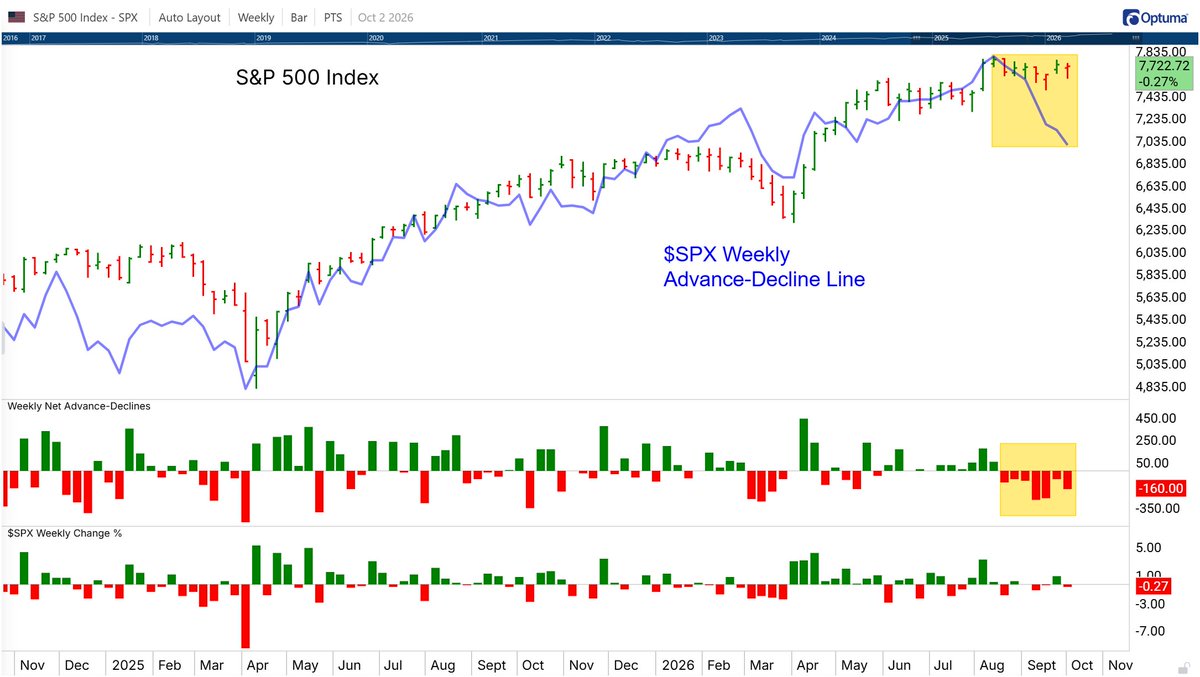
The $SPX may have gained 1.2% on the week, but 287 stocks close lower vs 216 higher, marking the 6th straight week of negative breadth.
This is the longest streak since tracking started in 2015.
The $SPX may have gained 1.2% on the week, but 287 stocks close lower vs 216 higher, marking the 6th straight week of negative breadth.
This is the longest streak since tracking started in 2015.
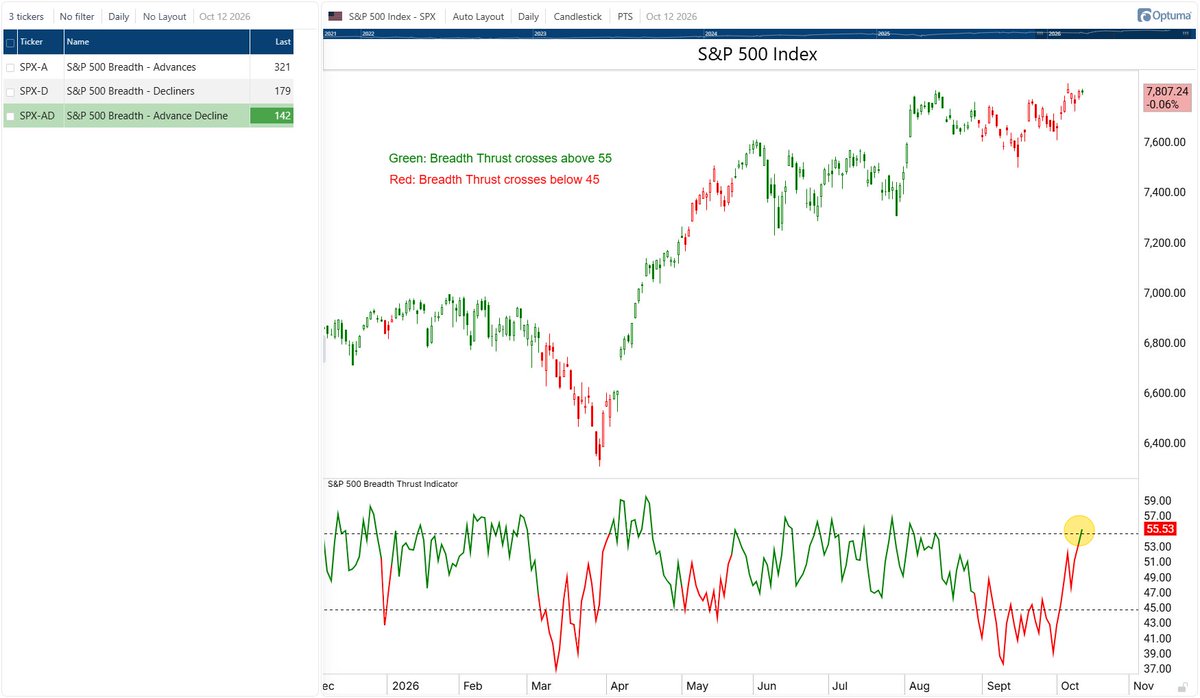
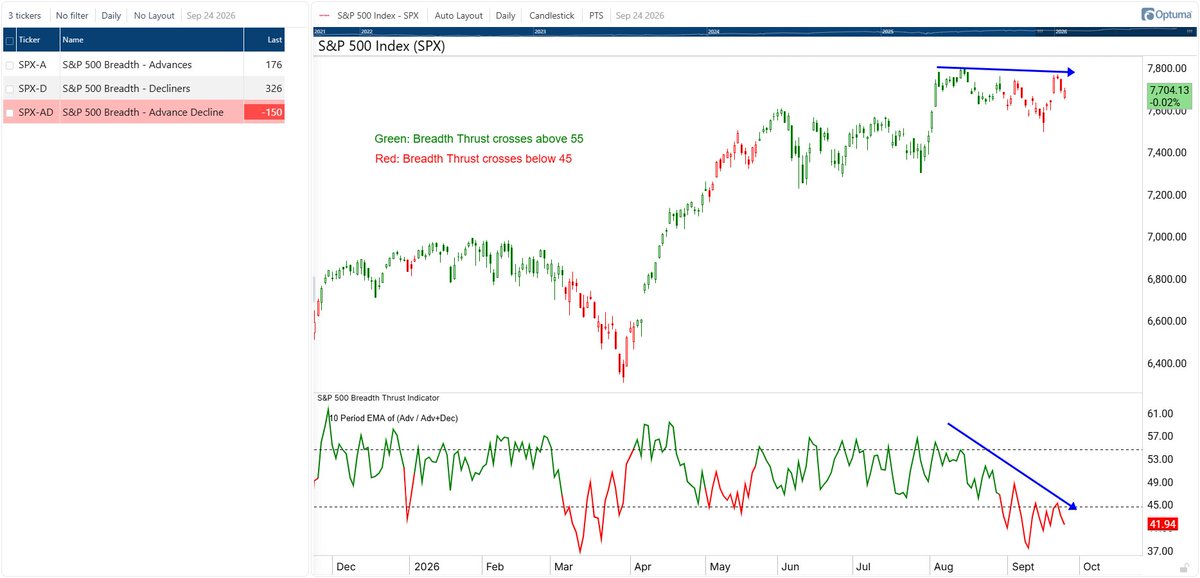
$SPX breadth continues to deteriorate. On Tuesday the index was flat with 249 stocks advancing and 253 declining. Today was flat again, but there were only 176 advancing and 326 declining:
Today is September 22.
According to historical seasonality, we’re entering the ugliest stretch of the month.
Seasonality is context, not a signal.
Let’s see which way the wind blows.
$SPX $SPY $QQQ @Optuma
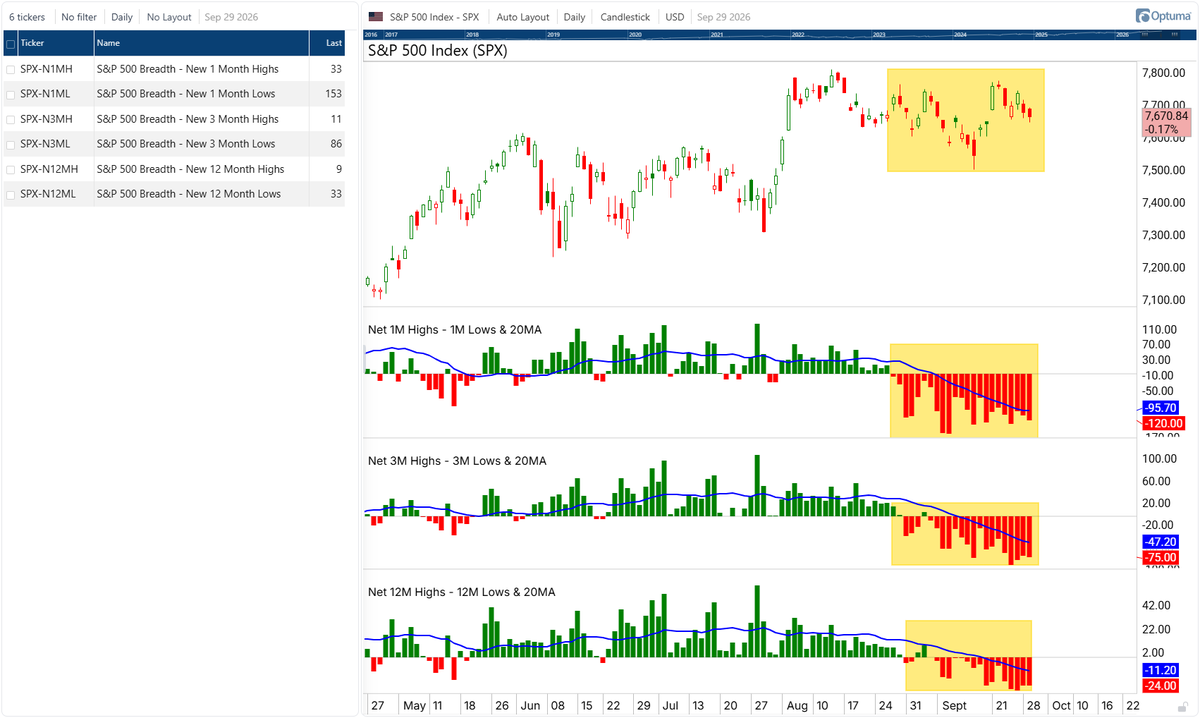
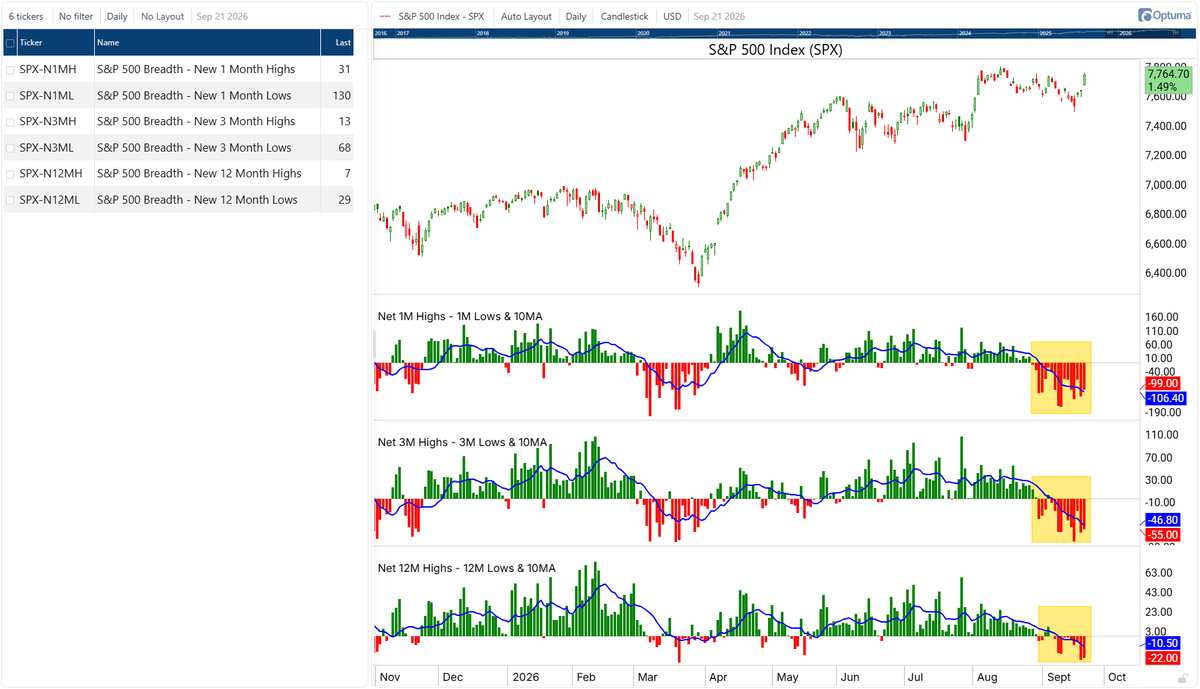
Despite the $SPX having its best day since August 4th, there were more stocks making new lows than highs:
-> 31 new 1 Month highs 130 new lows
-> 13 new 3 Months highs 68 new lows
-> 7 new 12 Month highs 29 new lows
It's been a similar story for the last few weeks: