Stock market crashed in,
2020 -34%
2008 -56%
2000 - 49%
1990 - 20%
1987 - 34%
1980 - 27%
1973 - 48%
… and recovered to all time highs each and every time!
$SPX $SPY $QQQ
@Gyngergod Look across all the major indexes. SPX, NDX, RUT, SMH and DJI are all trading inside last week's range. Two trading days left. Let's see how these weekly candles close on Friday.
$SPX — HISTORY KEEPS REPEATING ITSELF.
Every 4 consecutive weekly lows, the market followed with a V-shaped reversal each and every time.
History doesn't guarantee the next move, but ignoring a pattern this consistent is foolish.
The chart speaks for itself.
$SPY $QQQ
@LongtermR Exactly. Buyers have consistently stepped in after these weekly declines. Five completed reversals so far. Now let's see if the sixth follows the same pattern.
@MindMathMoney That's a fair way to test it. The study focuses on the reversal in price structure, not the 30-day return after the fourth weekly close. That's a separate study worth running.
@baggholding Maybe, maybe not. That's exactly why I said the cycle identifies the window, but price confirms the move. Nobody knows how deep this correction will go. Keep an eye on the 40-week EMA.
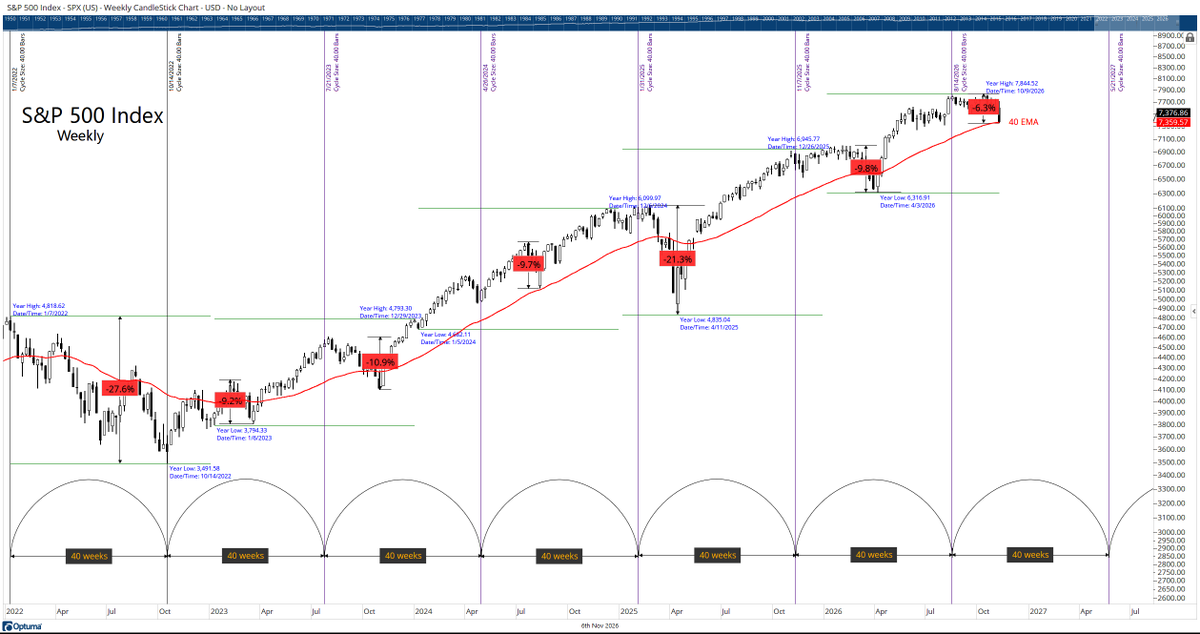
$SPX — THE 40-WEEK CYCLE UPDATE.
On August 5, I published the 40-week cycle study.
Three months later, here we are.
This cycle has been running since January 2022.
Every completed cycle has delivered a correction of roughly 10% or more.
The latest cycle marker arrived August 14, 2026.
As of November 6, the correction has reached approximately −6.3% peak to trough.
Is the correction finished? Nobody knows.
Does this guarantee another 10% decline? Absolutely not.
The cycle identifies the window. PRICE confirms the move.
The next 40-week marker is May 21, 2027.
I said it in August, and I'll say it again:
Trade what price does, not what you think it should do.
Bookmark this post. We'll circle back in a few months and see if history rhymes once again.
Original August 5 analysis attached below. 👇
https://t.co/6g7ytAsBcW
$SPY $QQQ @Optuma
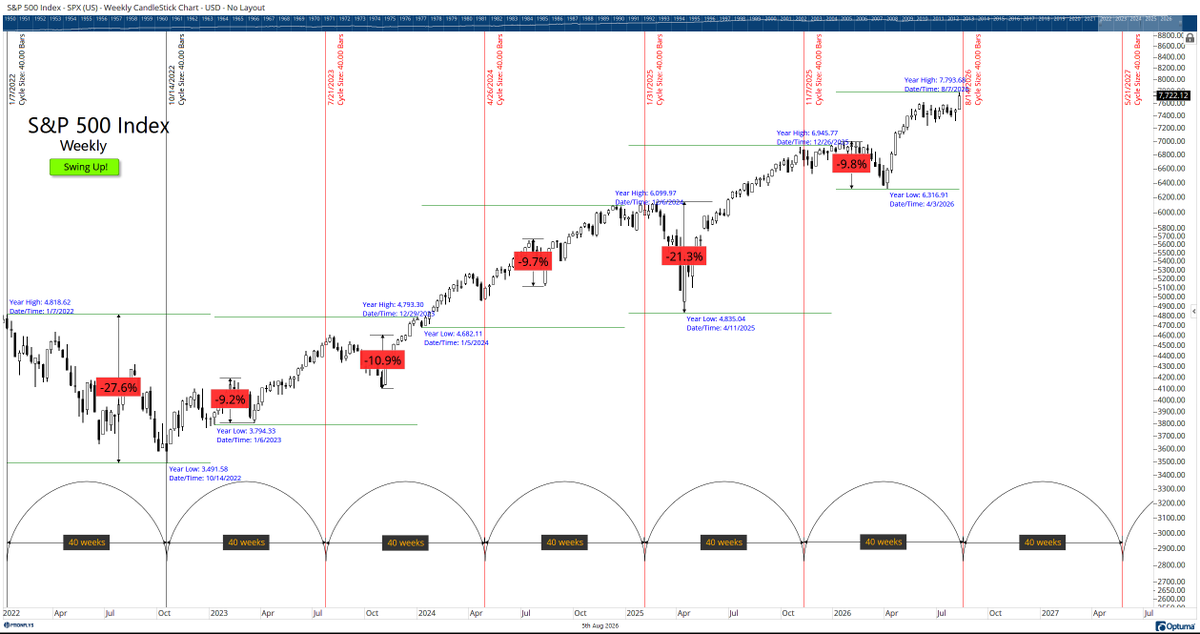
$SPX The 40-week cycle is not a market timing tool. It does not identify the exact top or bottom.
It simply opens a historical window where a meaningful correction has the potential to develop.
Since the 2022 bear market low, every completed 40-week cycle has produced a reset:
• -9.2%
• -10.9%
• -9.7%
• -21.3%
• -9.8%
The next 40-week window opens on August 14, 2026.
Does that mean the market tops in August?
Absolutely not.
It could happen in August, September, December, or several months later.
Cycles identify the window.
Price confirms the move.
Until the market starts printing lower highs and lower lows, the primary trend remains up.
Trade what price does-not what you think it should do.
Bookmark this post. We'll circle back in a few months and see if history rhymes once again.
$SPY $QQQ @Optuma
@AlgoTradeAlert That’s the idea, but a completed correction doesn’t automatically mean the next rally begins. I want to see the weekly structure rebuild, higher lows develop, and momentum turn. The cycle gives us the timing window. Price tells us when the repair is actually underway.
The baseline comparison is worth testing. Every completed 40-week cycle since January 2022 has produced a correction of 10% or more. That’s the historical observation. The cycle marks the timing window, price confirms the move, and I use the 40-week EMA as an additional reference to match the cycle’s time period.
That's literally what the chart is telling you. Four consecutive weekly lower lows mean the trend has weakened. Nobody said otherwise.
The point is that these stretches have happened before. Understanding historical price behavior isn't the same as pretending the trend is still up. Read the entire post.
$SPX | $QQQ | $SMH — The damage is in black and white
SPX: 4 consecutive weekly lower lows.
QQQ: 4 consecutive weekly lower lows.
SMH: 5 consecutive weekly lower lows.
Take a deep breath and look at the bigger picture.
There's nothing new here. Stretches of 4–5 consecutive weekly lower lows are a recurring feature of market corrections.
We've seen them before, and we'll see them again.
I've marked the key Fibonacci retracement zones on QQQ and SMH.
A bounce can happen anytime. That doesn't mean the correction is over.
Price decides. Not headlines.
$SPY
$SMH — SEMICONDUCTORS LEFT BEHIND AFTER THE ELECTION.
$DJI and $SPX rallying while semiconductors continue to struggle.
5 consecutive weeks of lower lows. The last time we saw this was during the 2022 bear market.
Could we see a sharp rebound? Absolutely.
Does oversold mean the bottom is in? Not necessarily.
History provides perspective. Price must confirm.
$SPY $QQQ