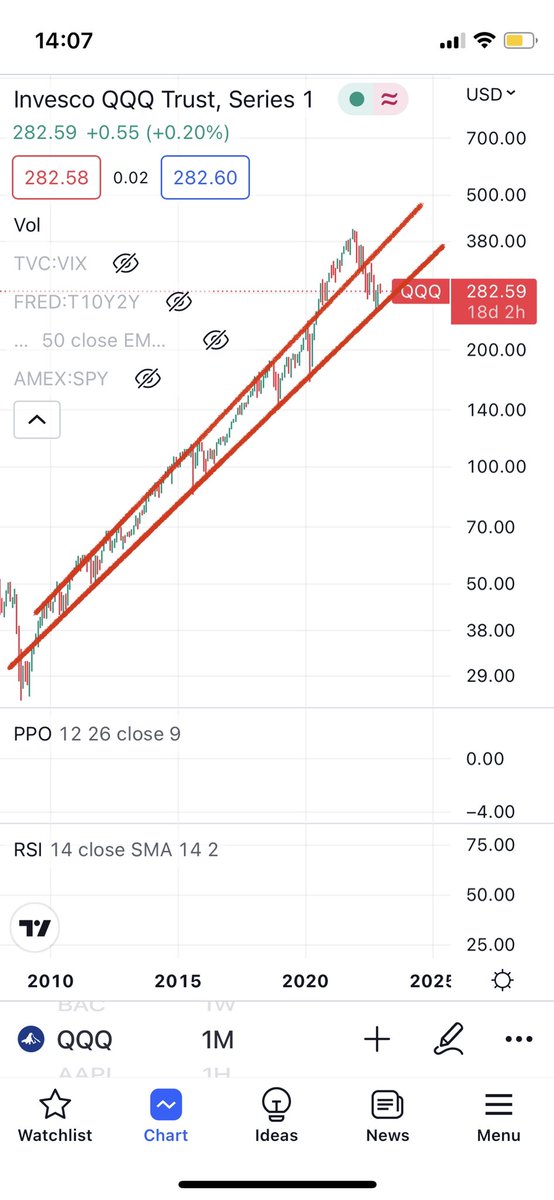
Nasdaq Update.
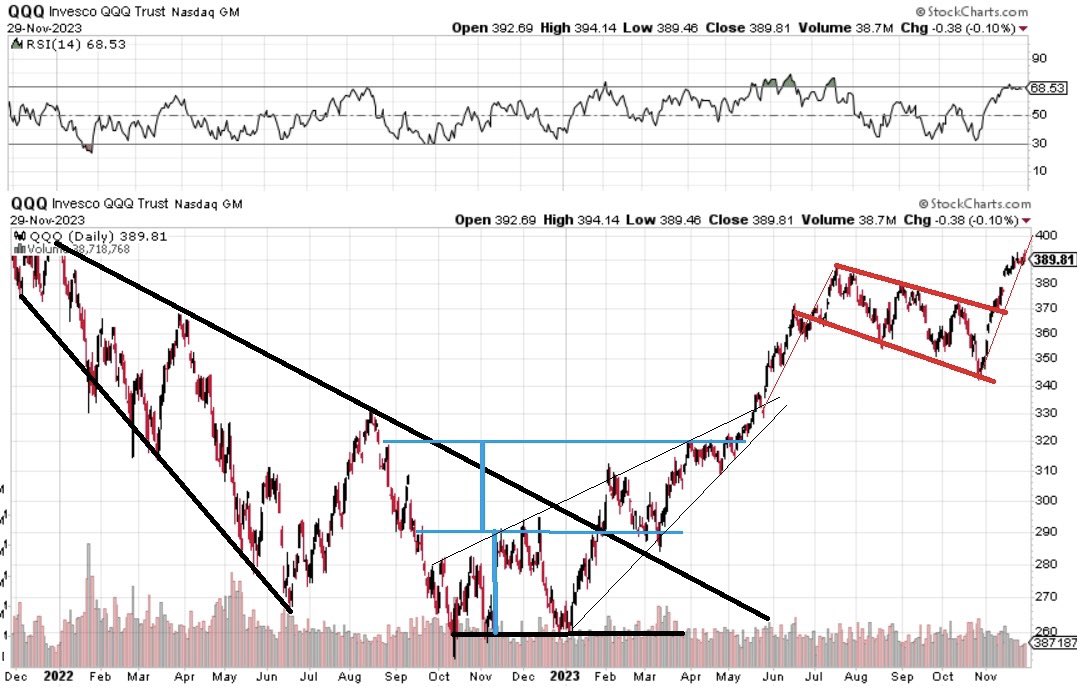
1.) Double bottom (blue) played out the rest of its targeted pattern. And the wedge broke out.
2.) Next, bull flag (red) recently broke out. Pattern dictates run up into flag has to come out. Start of run up depends on time frame.
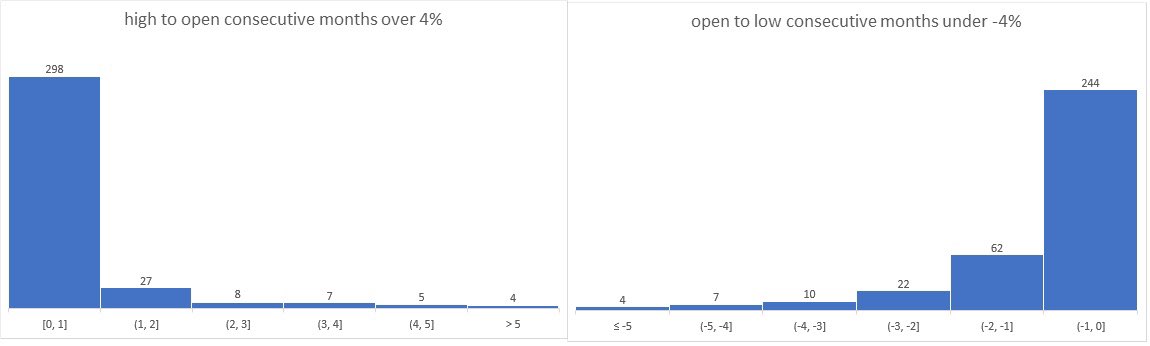
From the left chart (excuse that the date was not added), this is an event last seen at the bottom or Great Recession and before that, the bottom of the Dot-Com Bubble. This is not advice to invest, just a fun stat.
The SP500 has now had a 4% low from open in 5 consecutive months. Left: SPY (blue) with running consecutive total of months where trigger was hit (+/- 4% in a month from the open, green is +4%, grey is -4%) . Right is the green and gray’s distribution. Red is May.
This could be used as a sense that we move experienced a ‘sorta rare’ event right now. This data is SPY going back to 1993. May is the 5th month in a row that has had a low over 4% below it’s open.
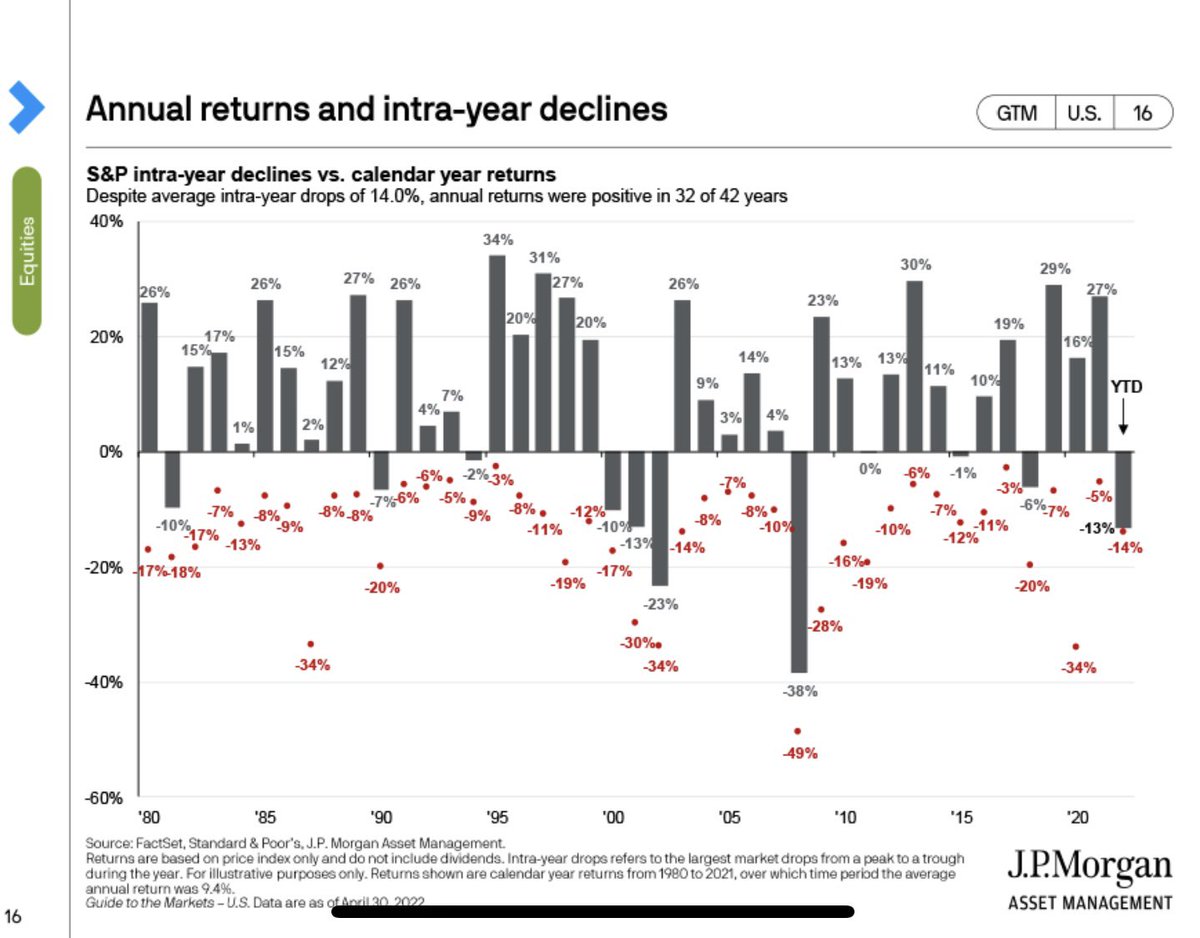
My thoughts on the current price action: the SP500 is at an attractive infra-year discount, largely due to technology, consumer discretionary and communication sectors.
Assuming these factors are resolved; we have an economy filled with consumers that have more income and cash then before and a lingering feeling to leave the house.