Instead of spending 2 hours on a movie...
Spend 1 hour watching this Anthropic Claude for Finance lecture.
It might be the most valuable free resource on quant AI available right now.
Bookmark it, make time for it today, and thank yourself later.
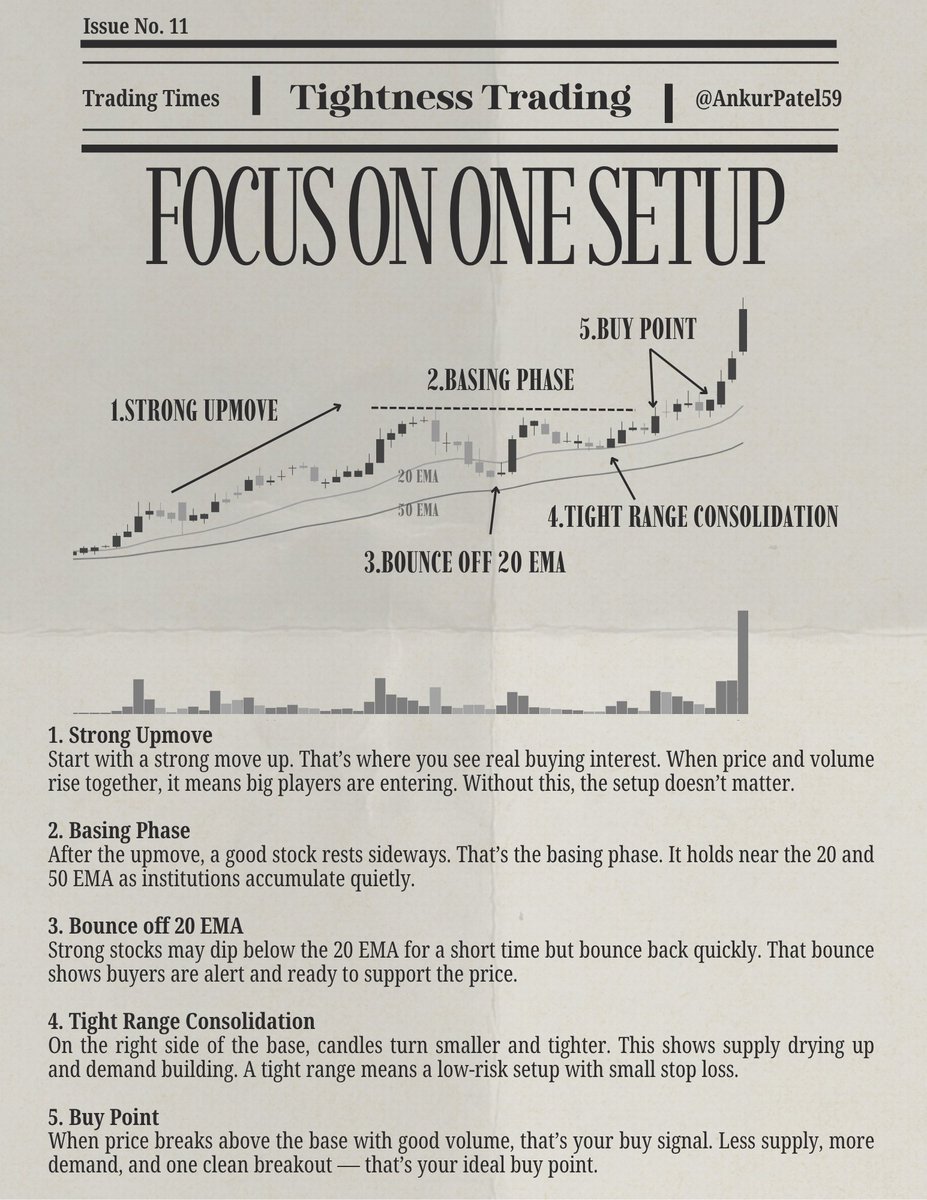
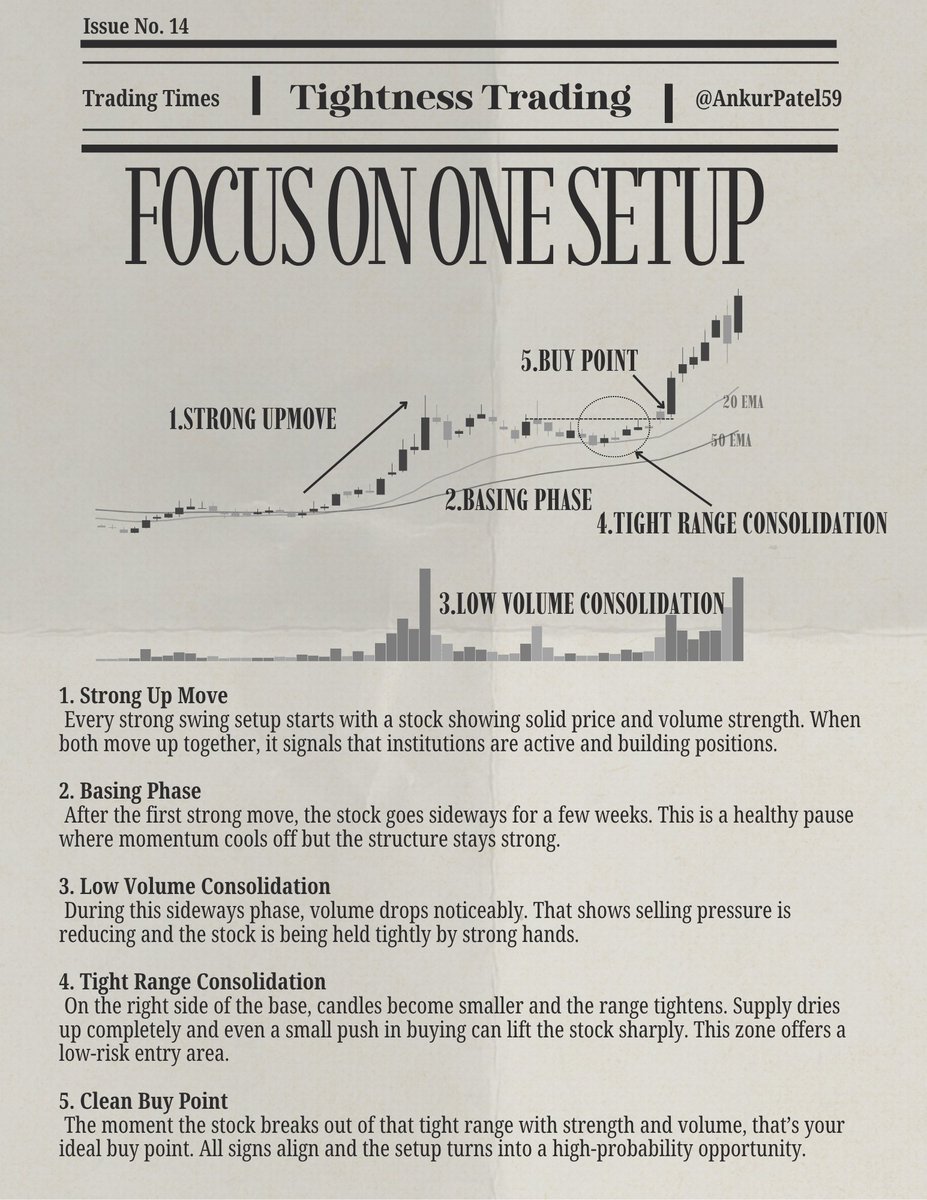
Most traders learn the pattern.But the real edge is in the small nuances inside the pattern.
The way price behaves. The way it builds. The way it breaks.Those small details often decide whether a trade works or fails.
This video explains some of these nuances that can help you make better trading decisions.
Video Language - Hindi
✍🏻Mark Minervini's VCP Pattern
Mark Minervini's Volatility Contraction Pattern (VCP) appears before nearly every major stock breakout. Here's how to spot it.
✍🏻What Is a VCP?
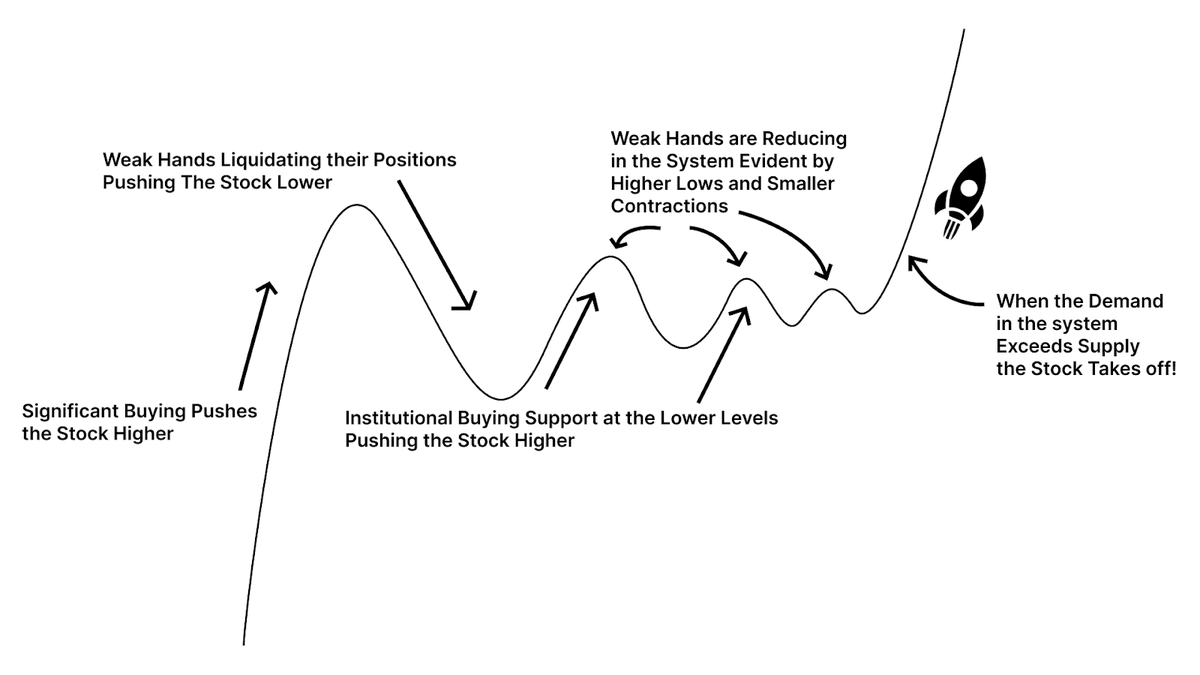
A stock goes through multiple pullbacks, but each pullback gets smaller and tighter. Like a coiled spring - the tighter the compression, the more explosive the release.
✍🏻The Four Stages
➡️Stage 1: The Initial Run
Significant buying pushes the stock higher. Institutions start accumulating.
➡️Stage 2: The Shakeout
Weak hands panic and sell. The stock drops 10-20%. This is the deepest pullback.
➡️Stage 3: The Contractions
Institutions buy the dip. The stock rallies again, but the next pullback is smaller - maybe 15%. Then it happens again with an even smaller pullback of 8-12%. Each correction is shallower than the last. Lows keep getting higher.
➡️Stage 4: The Breakout
Demand exceeds supply. No weak hands left to sell. The stock explodes higher.
✍🏻Why It Works
During those contractions, shares transfer from weak hands (emotional traders) to strong hands (institutions with conviction). Each pullback shakes out more sellers. By the final contraction, there's nobody left who wants to sell. That's when breakouts happen with force.
✍🏻The Three Must-Haves
➡️1. Higher Lows - Each pullback shallower than the previous (25% → 15% → 8%)
➡️2. Contracting Volatility - Price swings get smaller and smaller
➡️3. Volume Pattern - Light volume on pullbacks (no institutional selling), heavy volume on rallies (accumulation)
✍🏻What You're Looking For
- Strong initial move up ✓
- At least 2-3 contractions, each smaller than the last ✓
- Higher lows on each bottom ✓
- Trading tight near recent highs with low volatility ✓
- Decreasing volume on dips, increasing on rallies ✓
The longer and tighter the pattern, the more explosive the breakout.
✍🏻Avoid this mistake
Buying too early during the first or second contraction. You must wait for the pattern to complete - at least 2-3 contractions with each one smaller. Then when it breaks out on heavy volume, that's your entry.
✍🏻Why VCP works
When a stock completes a proper VCP, you're buying at the exact moment supply/demand shifts decisively to buyers. You're entering after weak hands exit and before the next institutional buying wave.
Minervini used VCPs to catch 100%, 200%, even 300%+ moves. Not prediction. Not hope. Just observation of a pattern that repeats across market history.
How did Oliver Kell post a +941% return and win the U.S. Investing Championship? By following ten simple principles without exception.
This guide breaks them down:
In 2022, India’s oil imports from Russia exploded after Western sanctions.
Result?
Russia now earns $60B+ in annual trade surplus with India.
But here’s the twist…
They get paid in rupees, which they can’t easily use back home.
So Russia had two bad options:
•Let rupees sit idle (₹ depreciation risk)
•Buy low-yield Indian bonds
But instead Putin just took the smartest third option:
Buy the Indian stock market.
What looks like an ETF launch… is actually a ₹5 lakh crore geopolitical hack.
Let’s decode the genius of India-Russia’s Nifty ETF deal
Bookmark and retweet this thread to revisit it later
Identify Which Sectors Showing Strong Sales Growth
I’ve created a simple interactive dashboard that lets you view Screener results using bar charts and pie charts.
You can also instantly see which stocks belong to which sector, making your analysis faster and more visual.
How to Use the Dashboard
1. Download the CSV file Click the Export button on this Screener link:
https://t.co/oY5TnEiavj
2. Convert the CSV to JSON
Use this online tool to convert your CSV file into a JSON file:
https://t.co/yvfr8ewook
3. Download the HTML file from the link below and open it in your browser:
https://t.co/Vp5BSchZvE
4. Upload your JSON file
Once uploaded, the dashboard will instantly display industry-wise growth charts.
Save & bookmark this tweet 📌📘
In coming 2-3 days there will be a lot of stocks in your scanning that will make green candles like this making you think you can trade it.
Instead of buying random setups have a look at this difference. Always go for setups that looks like B and not A !
This suggests that buyers did not sell stock even in market fall and are confident. Once market pressure eases off - B setups will fly, not A !
#Chartians #Stockmarket